


The Solution
The Solution
Designed a clear, visual experience that helps HR teams easily identify pay gaps and understand what actions to take without relying on analysts.
Simplified complex data into trustworthy insights and built guided, legally safe workflows to support compliant decisions.
Enabled one click, executive ready reporting so HR leaders can communicate findings and drive equity conversations at scale.
The Result
The Result
HR professionals felt more confident and self-sufficient, with a 70% reduction in analyst support requests for reporting and data interpretation.
Teams made pay equity decisions 35% faster by using guided flows and clear visual insights, reducing delays and hesitation.
Leadership engagement improved, as 60% of users reported better clarity and ease when presenting equity findings to executives.
Quick Summary
Quick Summary
Quick Summary
Project Overview
Project Overview
I led the end-to-end design of Pay Equity dashboard, this tool help HR teams identify, visualize, and address pay gaps. I designed an interactive system that simplified complex compensation data for non technical users.
I led the end-to-end design of Pay Equity dashboard, this tool help HR teams identify, visualize, and address pay gaps. I designed an interactive system that simplified complex compensation data for non technical users.

Platform: Web (Desktop-first)
Platform: Web (Desktop-first)
Duration: 3 months
Duration: 3 months
Role: Product/UX Designer
Role: Product/UX Designer
Team: Robin (PM), Liz (UX Head), Rayn (Dev), June (Content writer)
Team: Robin (PM), Liz (UX Head), Rayn (Dev), June (Content writer)
Project name: KF Pay Equity Tool
Project name: KF Pay Equity Tool
What is KF Pay Equity ?
What is KF Pay Equity ?
What is KF Pay Equity ?
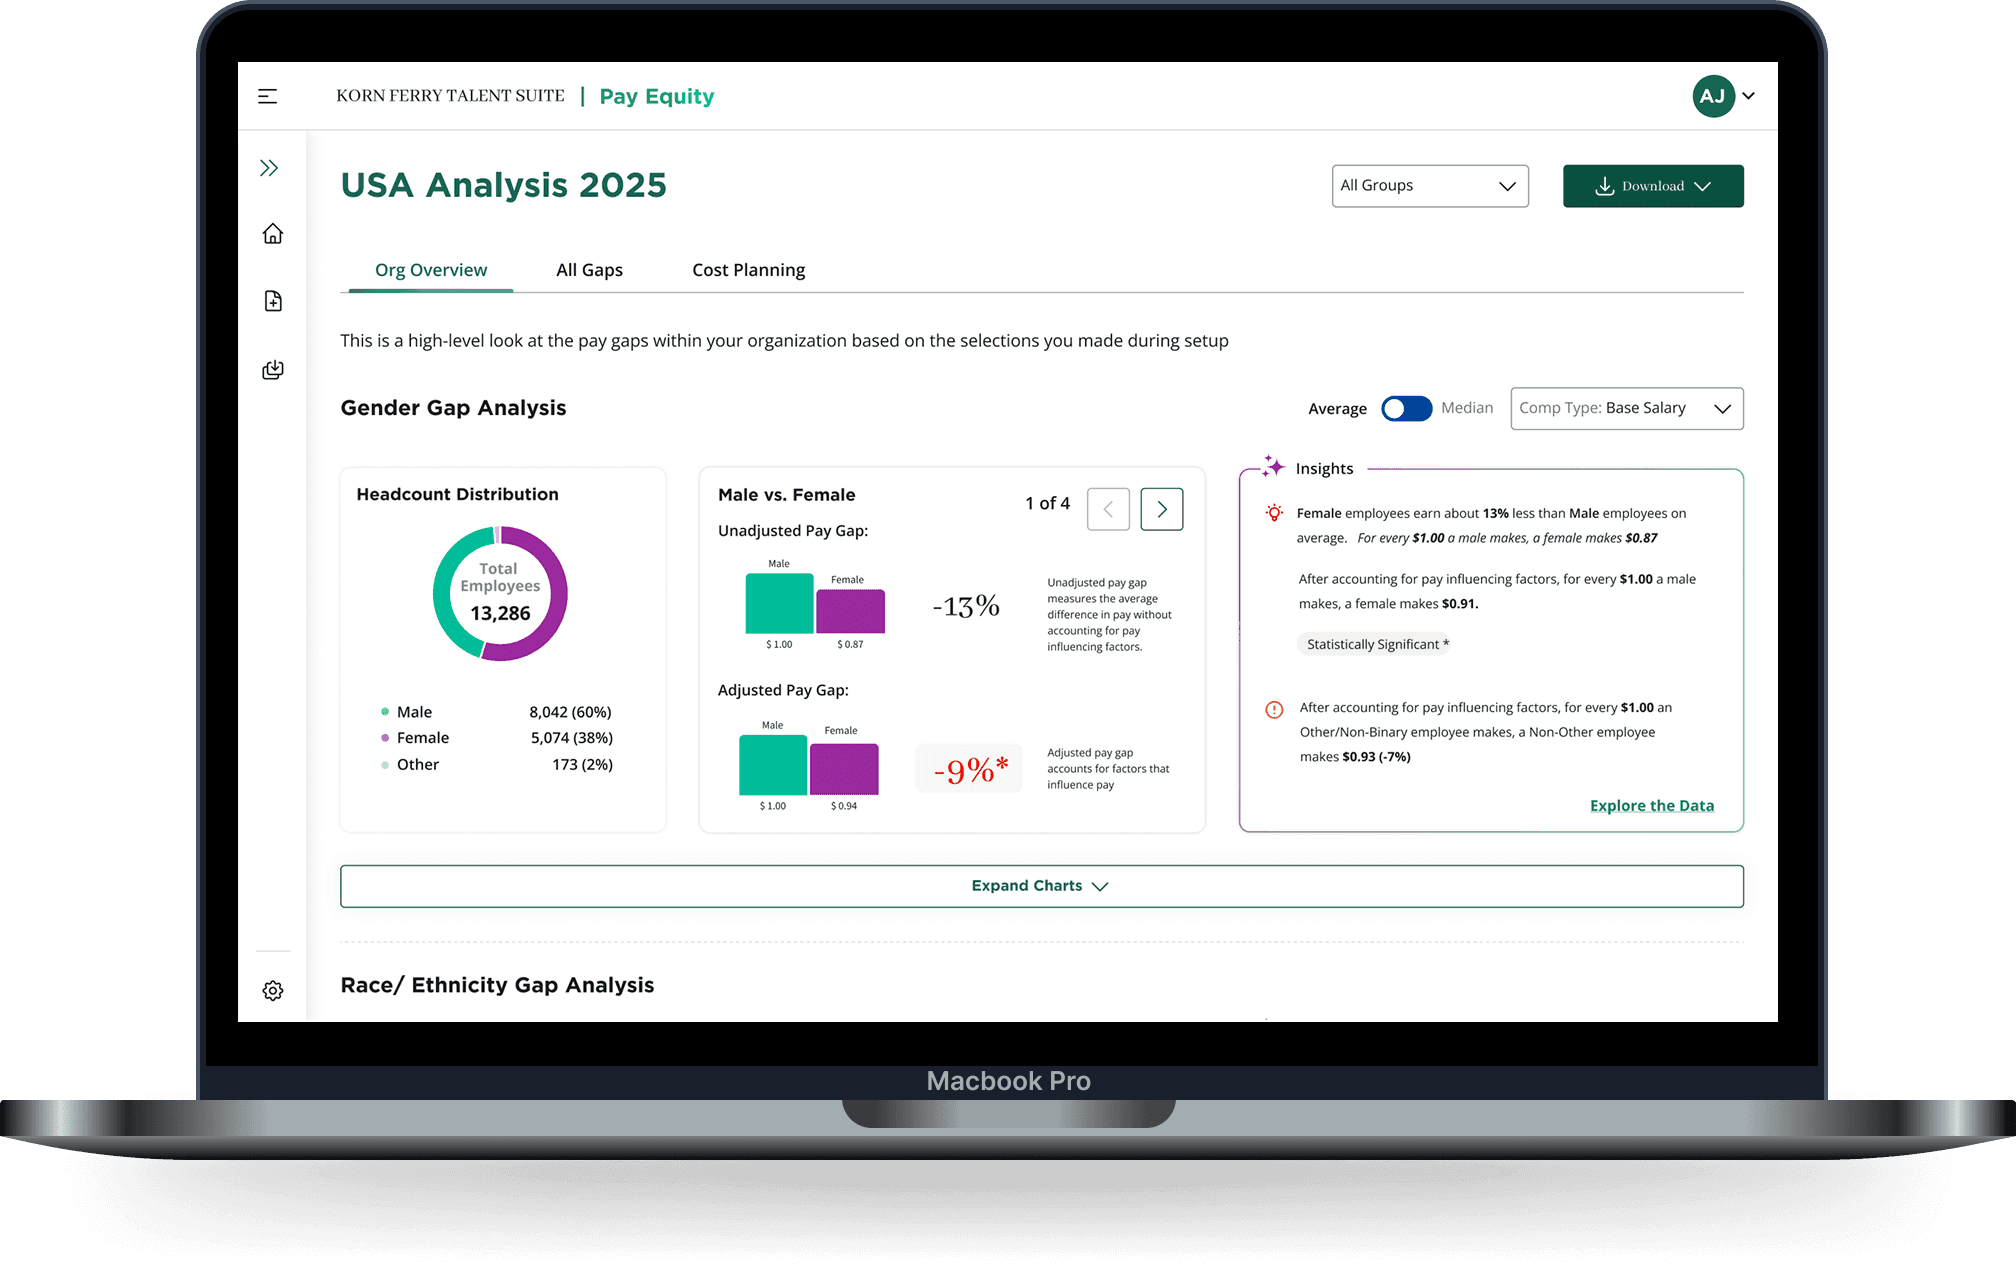
KF Pay Equity is a data driven dashboard designed to help HR, compensation teams to identify, understand, and act on pay disparities across their organization. This is built as part of Korn Ferry broader talent suite, it combines salary data, benchmarking, and demographic filters to bring hidden equity gaps to the surface with clearly.
KF Pay Equity is a data driven dashboard designed to help HR, compensation teams to identify, understand, and act on pay disparities across their organization. This is built as part of Korn Ferry broader talent suite, it combines salary data, benchmarking, and demographic filters to bring hidden equity gaps to the surface with clearly.
KF Pay Equity is a data driven dashboard designed to help HR, compensation teams to identify, understand, and act on pay disparities across their organization. This is built as part of Korn Ferry broader talent suite, it combines salary data, benchmarking, and demographic filters to bring hidden equity gaps to the surface with clearly.

Why It Matters
Why It Matters
Why It Matters
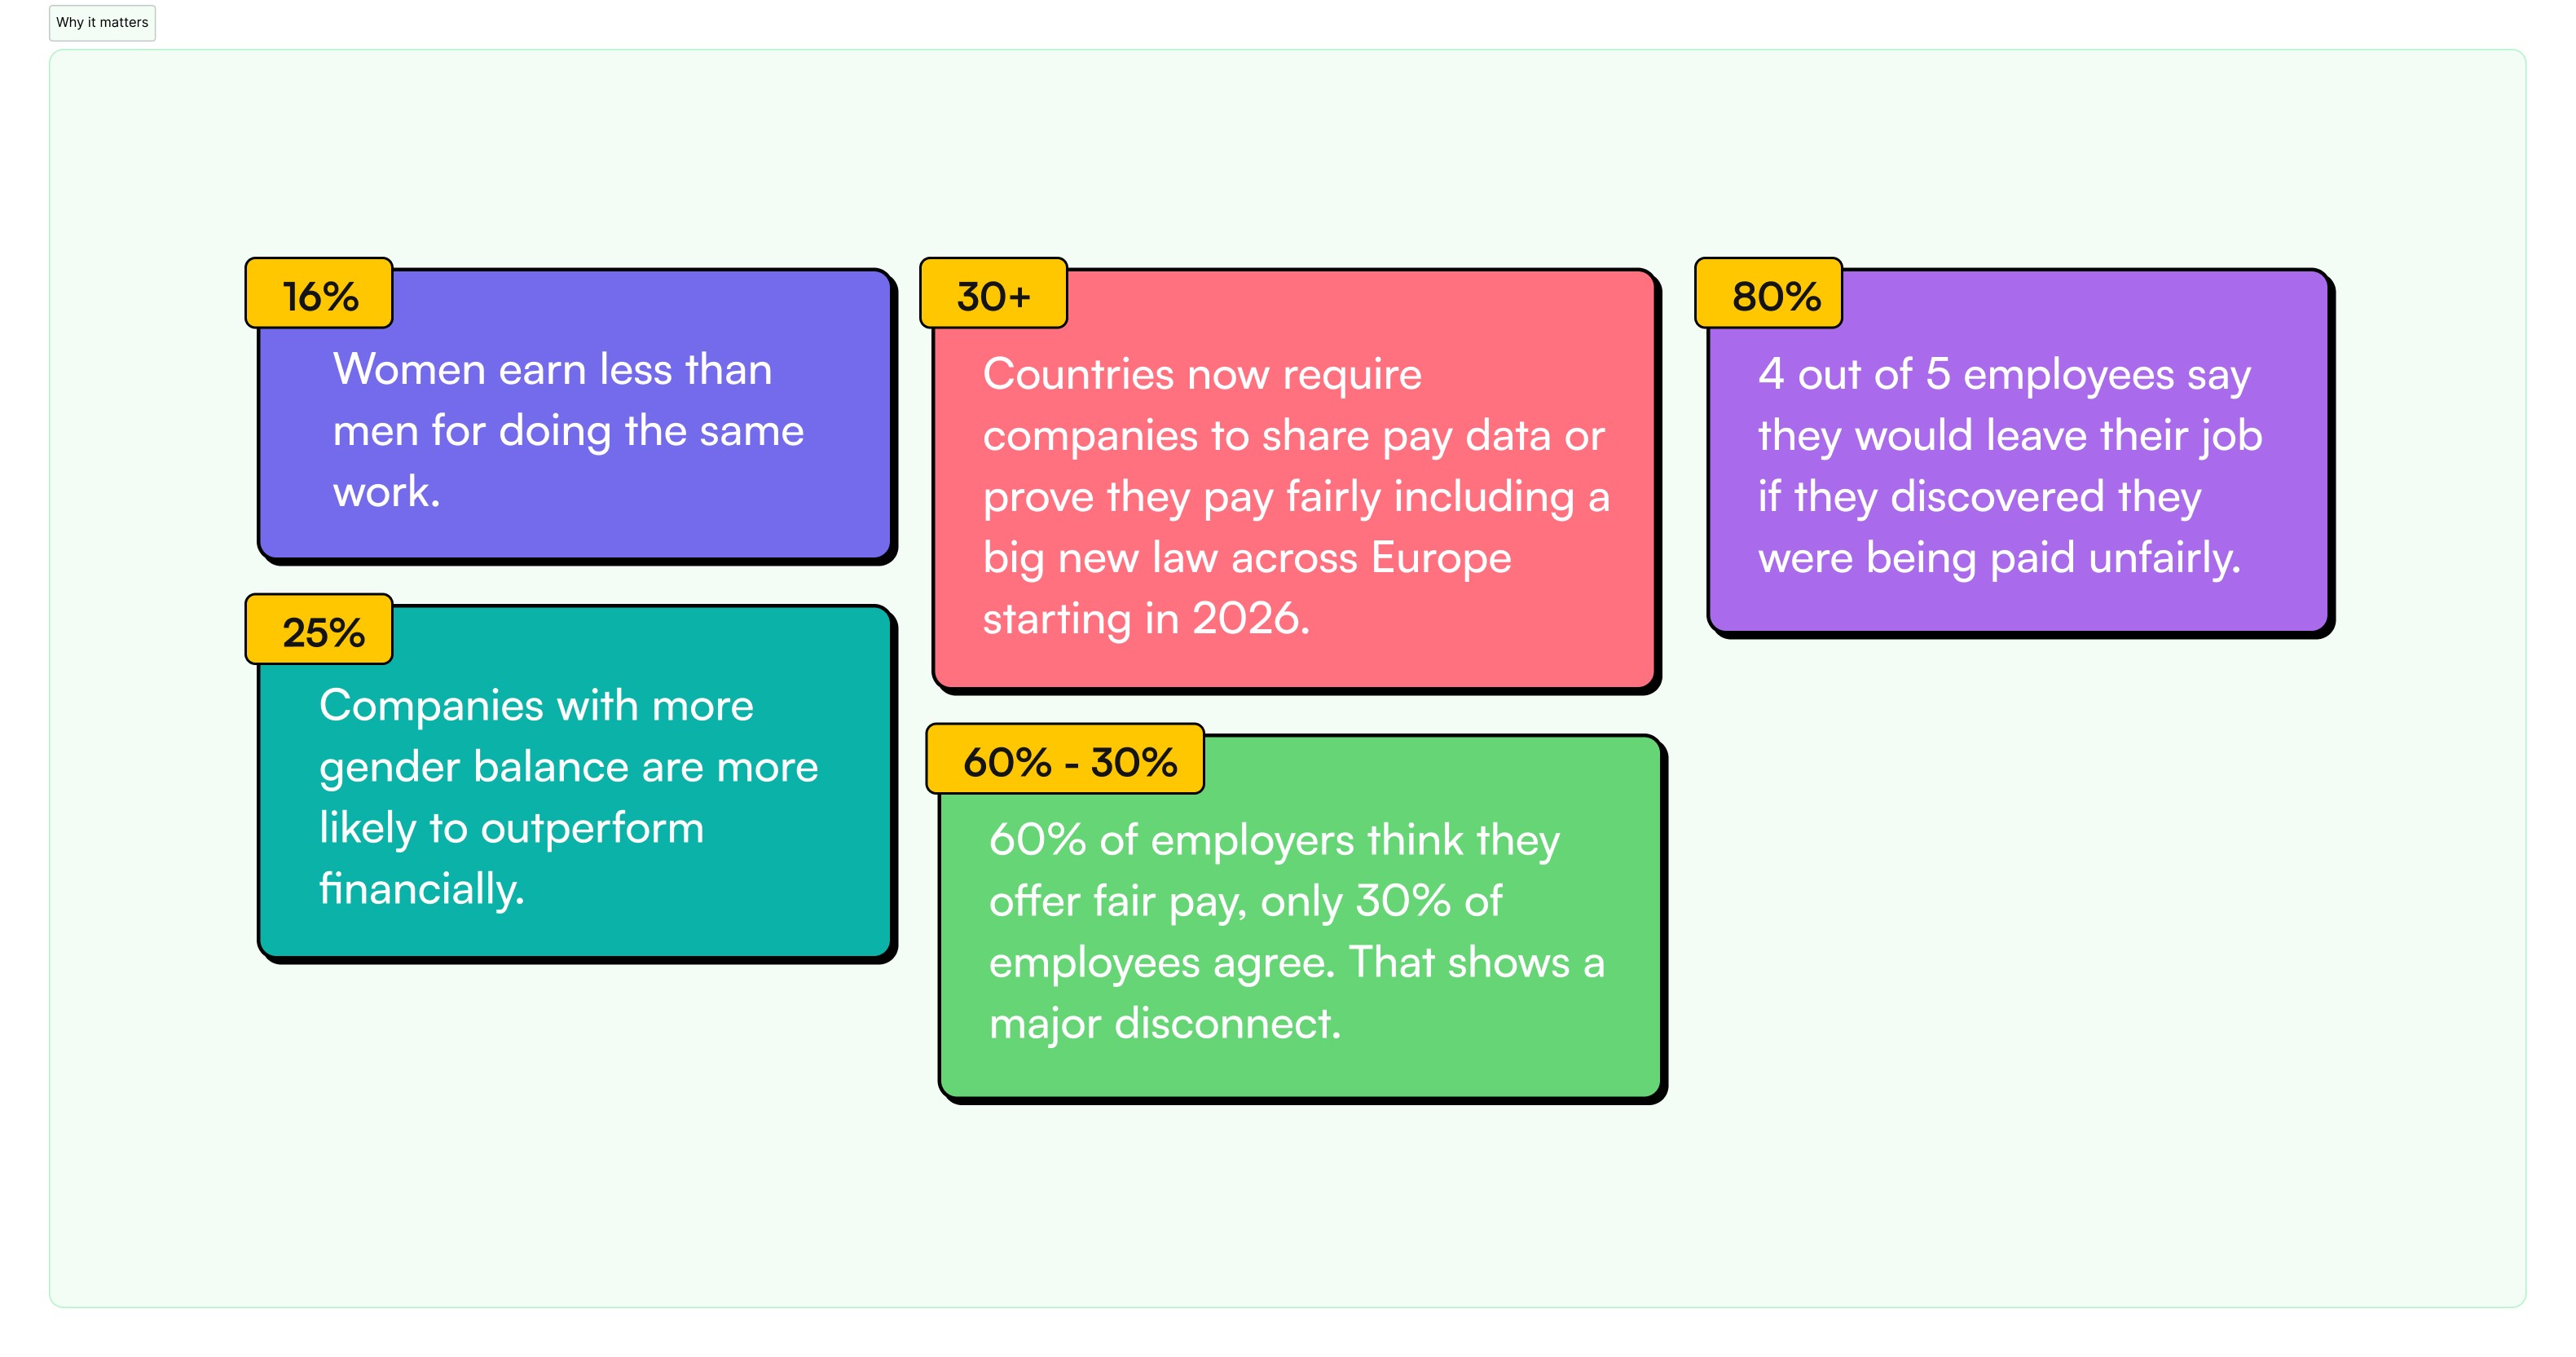
Despite having access to compensation data, many HR teams struggle to turn it into clear and actionable insights. Gaps are often hidden, hard to communicate, or ignored due to lack of tools. KF Pay Equity addresses this by giving users visibility, control, and confidence to take action.
Despite having access to compensation data, many HR teams struggle to turn it into clear and actionable insights. Gaps are often hidden, hard to communicate, or ignored due to lack of tools. KF Pay Equity addresses this by giving users visibility, control, and confidence to take action.
Despite having access to compensation data, many HR teams struggle to turn it into clear and actionable insights. Gaps are often hidden, hard to communicate, or ignored due to lack of tools. KF Pay Equity addresses this by giving users visibility, control, and confidence to take action.
Project Overview
I led the end-to-end design of Pay Equity dashboard, this tool help HR teams identify, visualize, and address pay gaps. I designed an interactive system that simplified complex compensation data for non technical users.
Platform: Web (Desktop-first)
Duration: 3 months
Role: Product/UX Designer
Team: Robin (PM), Liz (UX Head), Rayn (Dev), June (Content writer)
Project name: KF Pay Equity Tool
Problem Statement
Problem Statement
Problem Statement
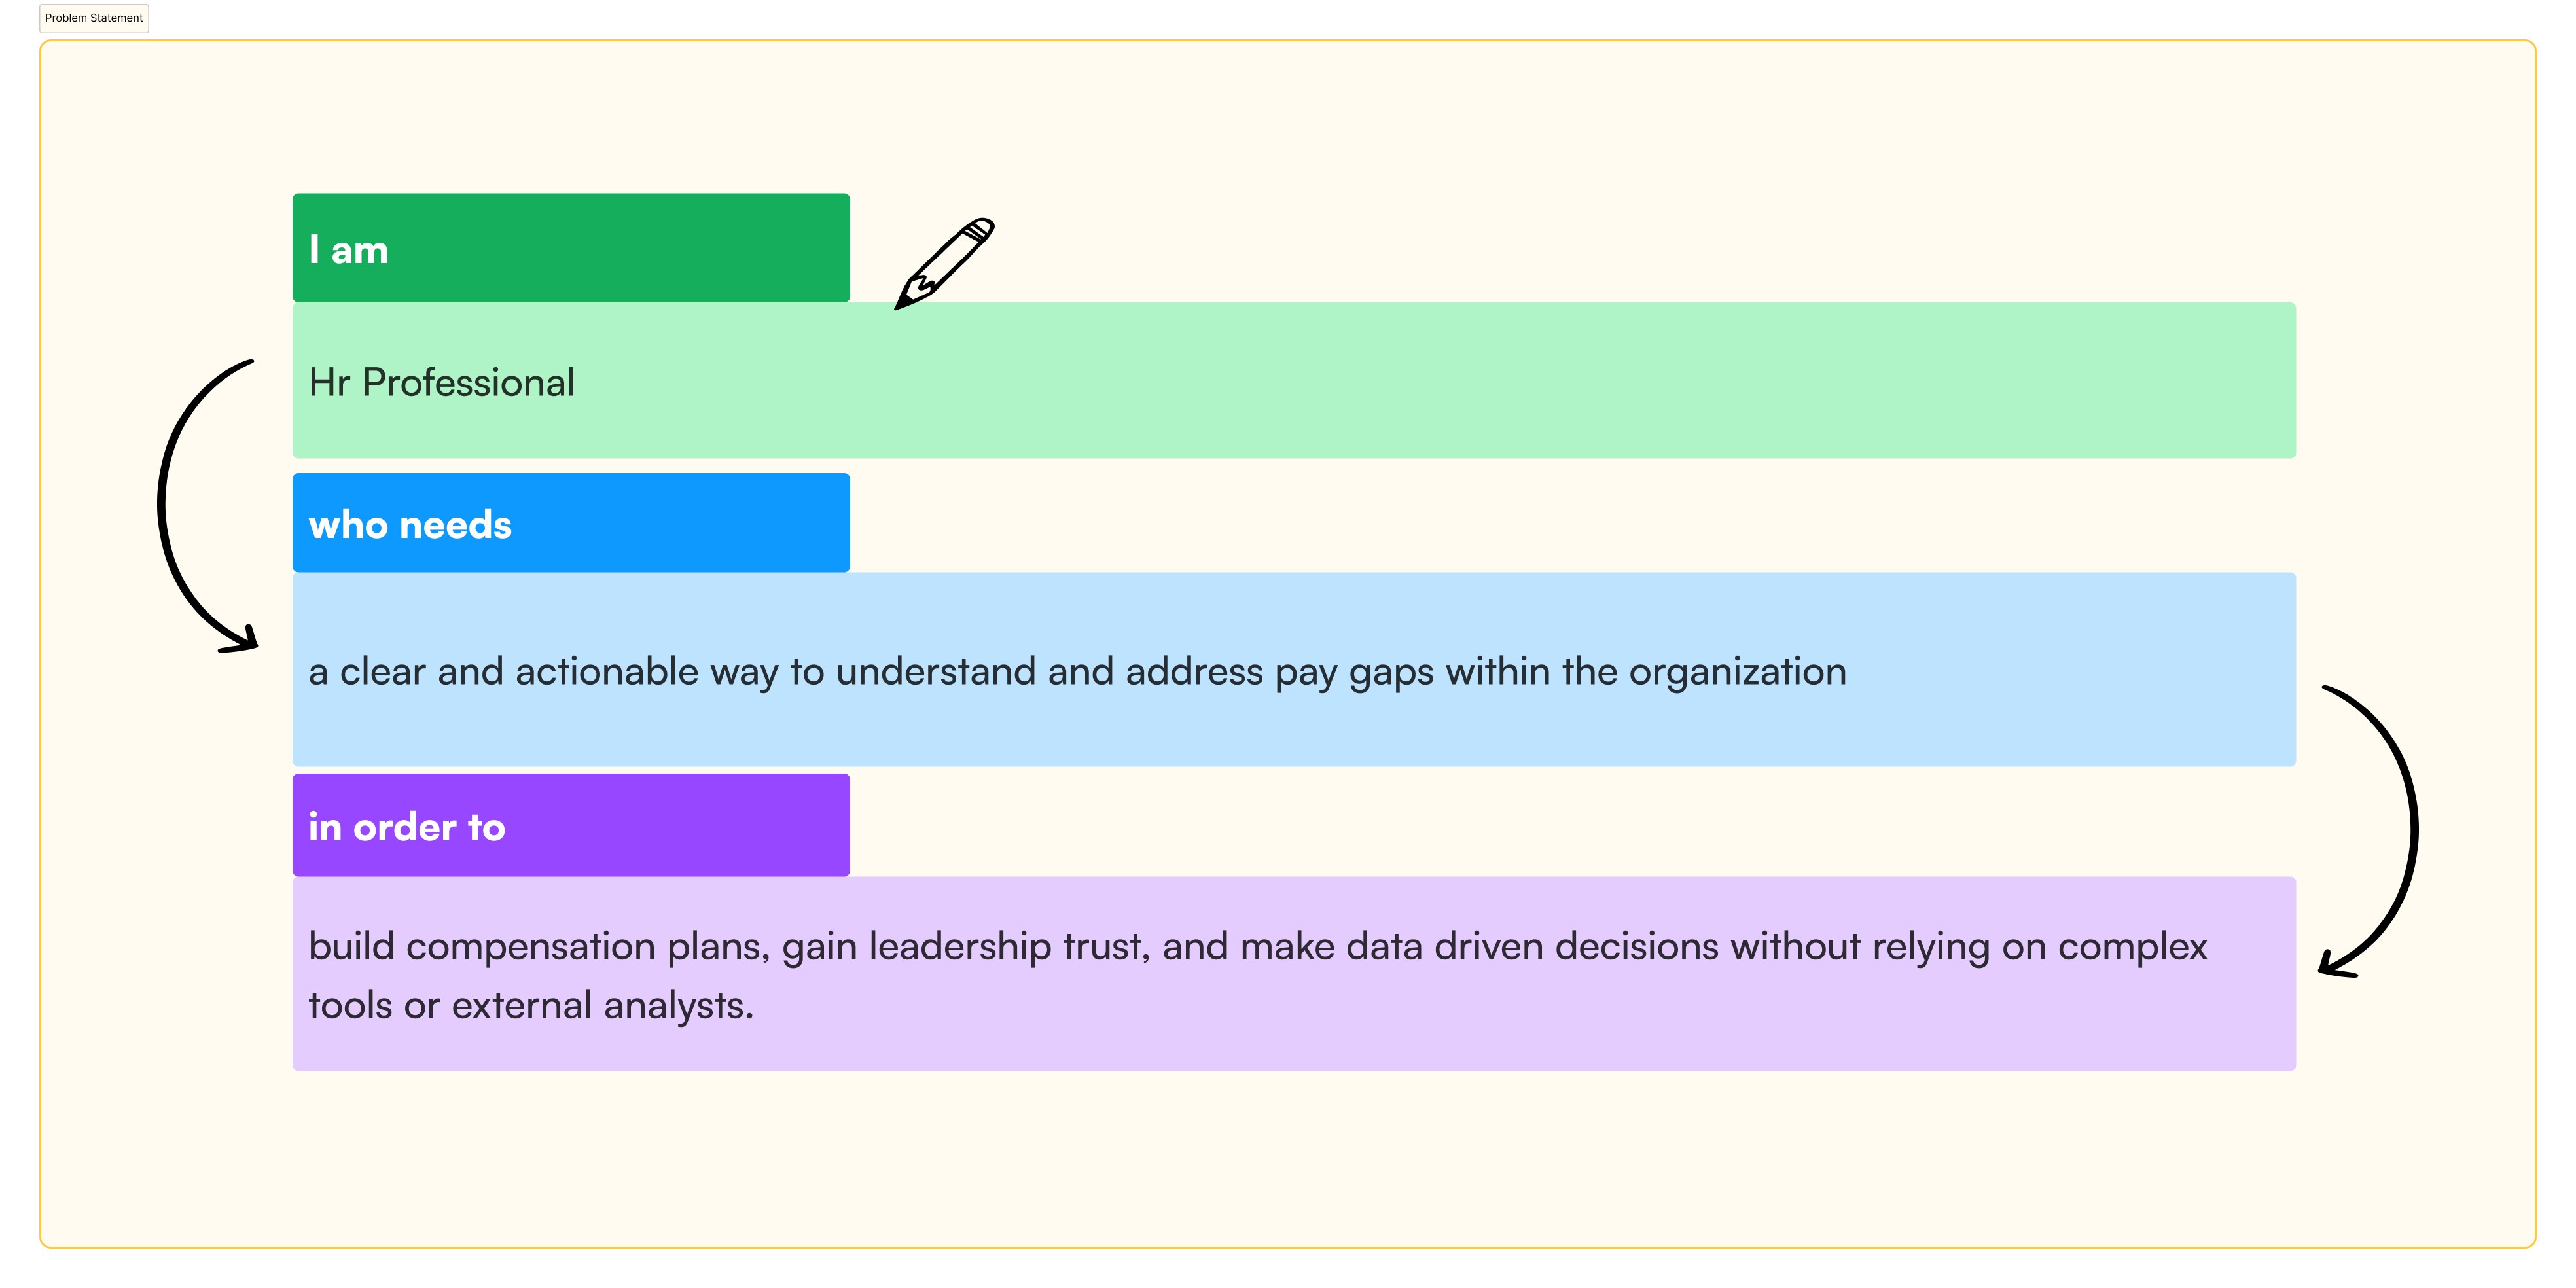
To set the foundation for the design, I started by defining the core problem from the user's point of view.
To set the foundation for the design, I started by defining the core problem from the user's point of view.
To set the foundation for the design, I started by defining the core problem from the user's point of view.
Hypothesis Statement
Hypothesis Statement
Hypothesis Statement
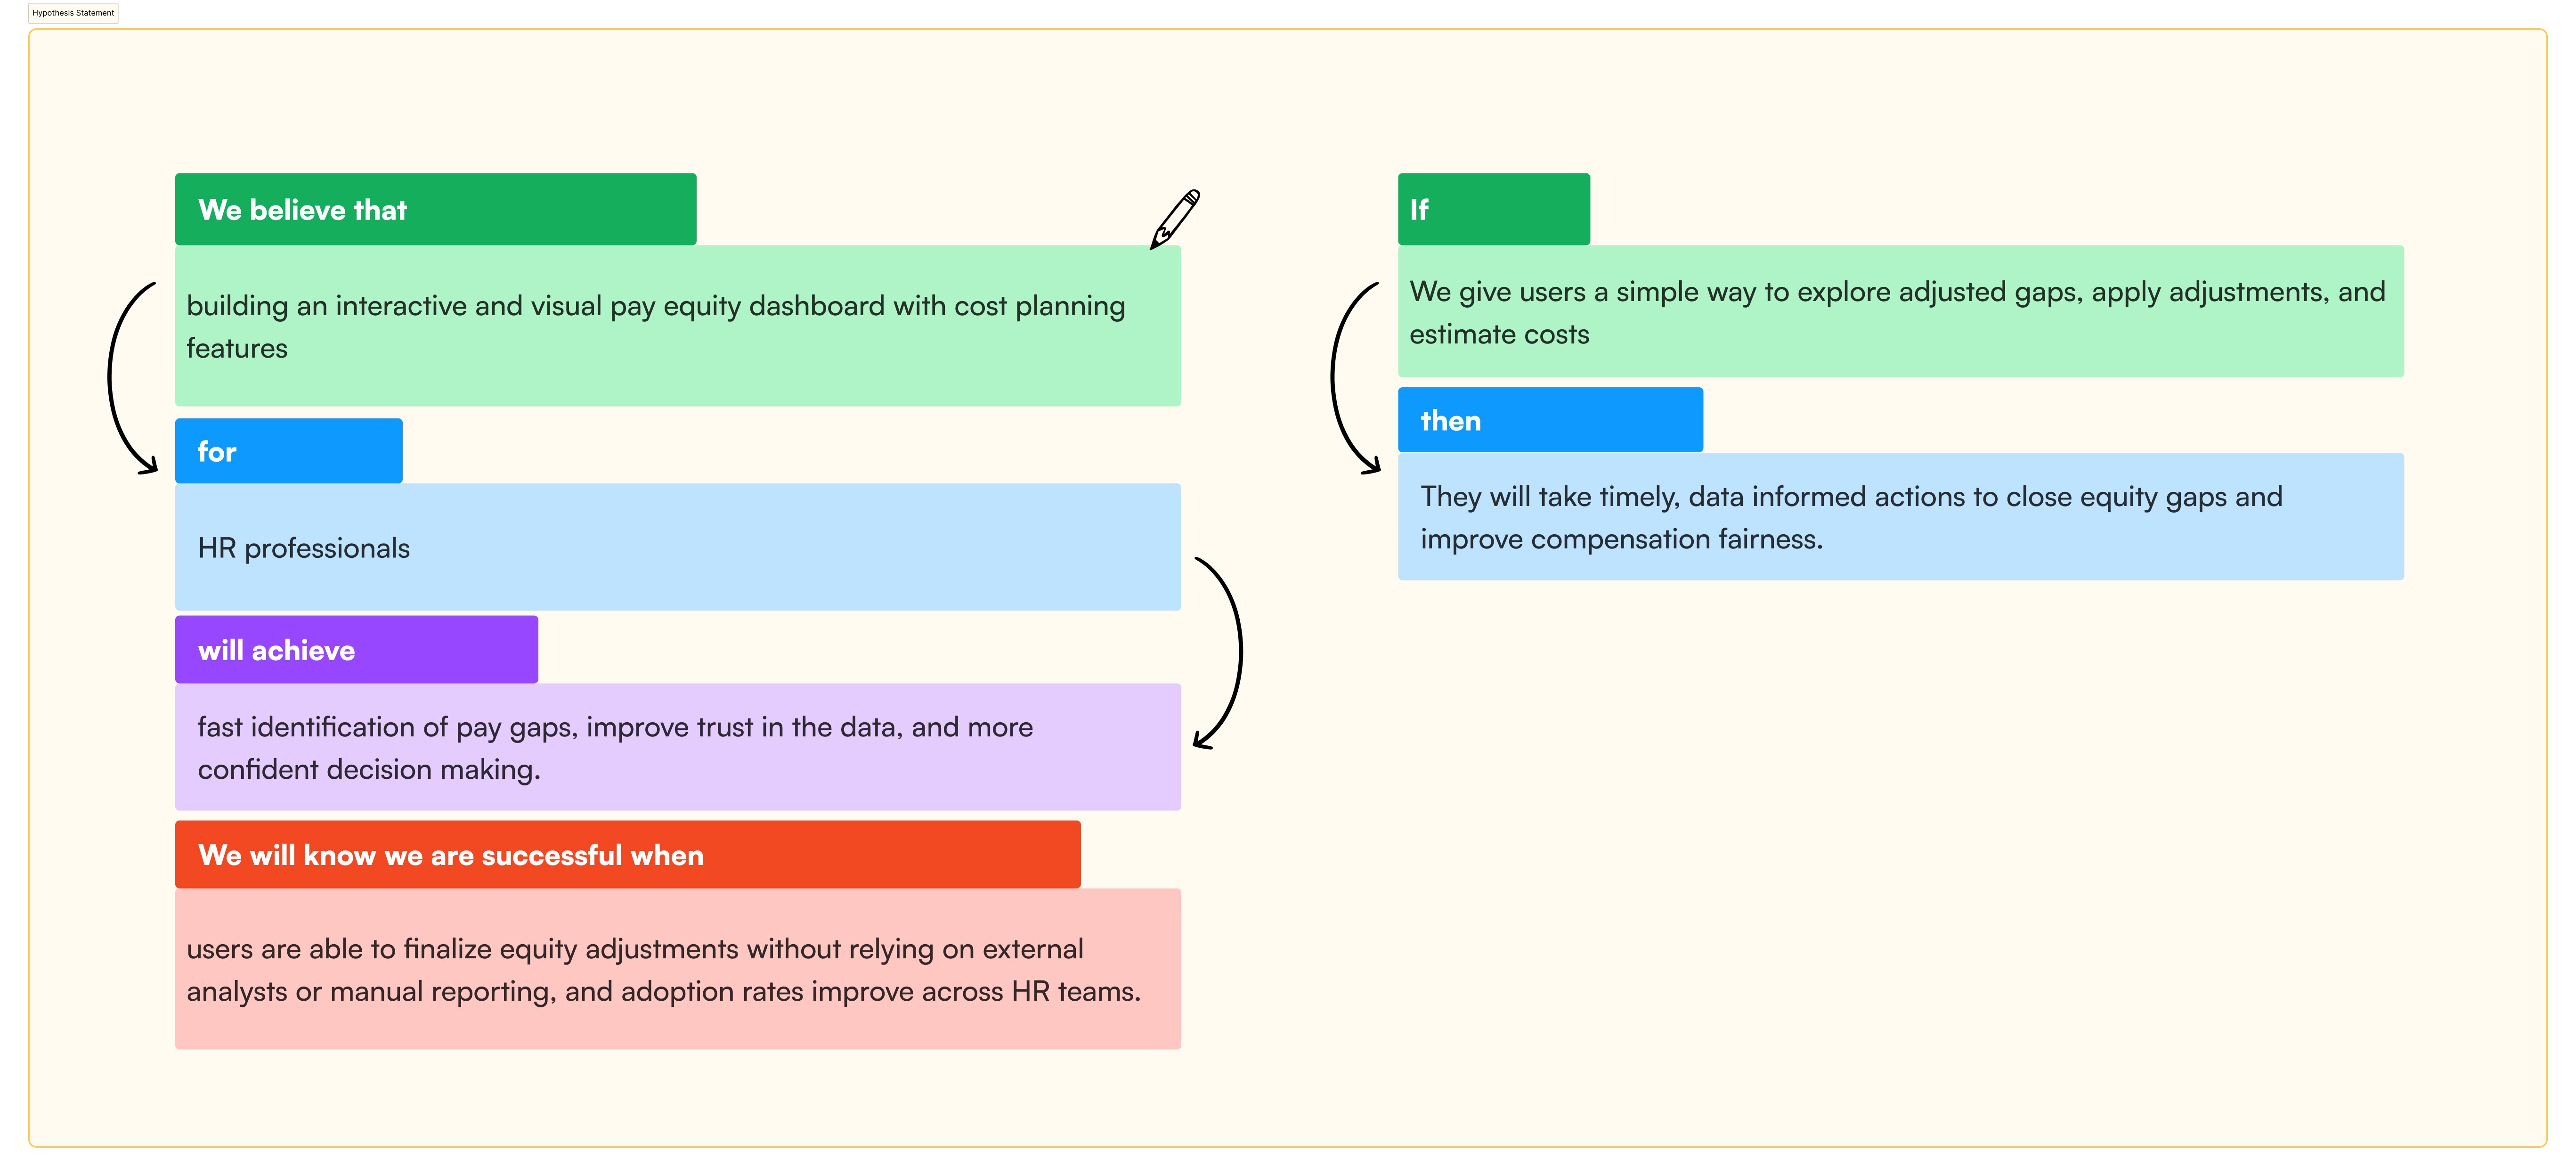
Before designing, I made a hypothesis about what could help users and how we measure success.
Before designing, I made a hypothesis about what could help users and how we measure success.
Before designing, I made a hypothesis about what could help users and how we measure success.

Strategic Planning
Before diving into design, Worked closely with the product manager, data team, and key stakeholders to define what success would look like, both for the business and the people using the product.
01 Primary Goals
Help HR teams to easily identify pay gaps by gender, role, and location.
Simplify complex data into clear, visual insights that non technical users can understand.
Make it easier to act quickly and confidently when equity issues are found.
Build trust through consistent UI patterns and explainable metrics.
02 Constrains
Limited engineering time meant we needed to design around existing data pipelines.
The product had to be usable by both large enterprise teams and smaller regional HR units.
Stakeholders wanted a flexible dashboard that could support future pay models and filters.
03 What success look like
Reduce time spent and drop off.
Identify pay gaps and make adjustments.
Increase confidence in data interpretation among HR users.
Ensure users could generate reports and equity summaries without needing help from analysts.
04 Design Approach
Start with real user needs and uncover behaviors through interviews and testing.
Prioritize visual clarity, accessibility over complexity.
Design reusable components that scale with different data sizes and org structures.

Design Process
I followed the Double Diamond process, I identified key user pain points, explored solutions, and delivered a prototype that supports informed pay equity decisions.
Discover
Conducted user interviews with HR managers, compensation analysts, and executives.
Find out user pain points through empathy mapping.
Researched about existing tools like: Syndio, PayScale, and Workday to find gaps.
Understanding the Problem
Define
We synthesized research data to reveal themes and patterns.
Built user personas like Christina- Senior HR Partner.
We clearly defined the problem and Aligned with stakeholders on goals.
Framing the Challenge
Develop
We brainstormed solutions based on research insights and user personas.
Created user journeys, task flows, and information architecture.
Designed wireframes focused on key actions.
Designing Solution
Strategic Planning
Strategic Planning
Before diving into design, Worked closely with the product manager, data team, and key stakeholders to define what success would look like, both for the business and the people using the product.
Before diving into design, Worked closely with the product manager, data team, and key stakeholders to define what success would look like, both for the business and the people using the product.
01
Primary Goals
01
Primary Goals
Help HR teams to easily identify pay gaps by gender, role, and location.
Simplify complex data into clear, visual insights that non technical users can understand.
Make it easier to act quickly and confidently when equity issues are found.
Build trust through consistent UI patterns and explainable metrics.
02
Constrains
02
Constrains
Limited engineering time meant we needed to design around existing data pipelines.
The product had to be usable by both large enterprise teams and smaller regional HR units.
Stakeholders wanted a flexible dashboard that could support future pay models and filters.
Limited engineering time meant we needed to design around existing data pipelines.
The product had to be usable by both large enterprise teams and smaller regional HR units.
Stakeholders wanted a flexible dashboard that could support future pay models and filters.
03
What success look like
03
What success look like
Reduce time spent and drop off.
Identify pay gaps and make adjustments.
Increase confidence in data interpretation among HR users.
Ensure users could generate reports and equity summaries without needing help from analysts.
Reduce time spent and drop off.
Identify pay gaps and make adjustments.
Increase confidence in data interpretation among HR users.
Ensure users could generate reports and equity summaries without needing help from analysts.
04
Design Approach
04
Design Approach
Start with real user needs and uncover behaviors through interviews and testing.
Prioritize visual clarity, accessibility over complexity.
Design reusable components that scale with different data sizes and org structures.
Start with real user needs and uncover behaviors through interviews and testing.
Prioritize visual clarity, accessibility over complexity.
Design reusable components that scale with different data sizes and org structures.
Conducted user interviews with HR managers, compensation analysts, and executives.
Find out user pain points through empathy mapping.
Researched about existing tools like: Syndio, PayScale, and Workday to find gaps.
Understanding the Problem
Discover
We synthesized research data to reveal themes and patterns.
Built user personas like Christina- Senior HR Partner.
We clearly defined the problem and Aligned with stakeholders on goals.
Framing the Challenge
Define
We brainstormed solutions based on research insights and user personas.
Created user journeys, task flows, and information architecture.
Designed wireframes focused on key actions.
Designing Solution
Develop
Shared interactive prototype for internal testing.
Collaborated with PM and developers for feedback and feasibility.
Refined visuals based on usability reviews.
Implementing and launching
Deliver
Design Process
Design Process
I followed the Double Diamond process, I identified key user pain points, explored solutions, and delivered a prototype that supports informed pay equity decisions.
I followed the Double Diamond process, I identified key user pain points, explored solutions, and delivered a prototype that supports informed pay equity decisions.
Interview Insights
Interview Insights
Interview Insights
In an interview, a researcher asks a users open ended questions about a specific topic. The questions are designed to encourage the user to share their stories and experiences in their own words.
In an interview, a researcher asks a users open ended questions about a specific topic. The questions are designed to encourage the user to share their stories and experiences in their own words.
In an interview, a researcher asks a users open ended questions about a specific topic. The questions are designed to encourage the user to share their stories and experiences in their own words.
“I have the data, but it’s all over the place. I spend hours trying to make sense of it before I can even explain it to leadership.”
“I have the data, but it’s all over the place. I spend hours trying to make sense of it before I can even explain it to leadership.”
“What’s really missing is clarity. I want the system to guide me, where the gaps are, what to do about them, and how to track progress.”
“What’s really missing is clarity. I want the system to guide me, where the gaps are, what to do about them, and how to track progress.”
“I need to break down gaps by role, level, gender, but the current tool does not allow.
“I need to break down gaps by role, level, gender, but the current tool does not allow.
“Our goal is to be fair, but I can not advocate for change without clear visuals that leadership can trust and act on.”
“Our goal is to be fair, but I can not advocate for change without clear visuals that leadership can trust and act on.”
“I have the data, but it’s all over the place. I spend hours trying to make sense of it before I can even explain it to leadership.”
“What’s really missing is clarity. I want the system to guide me, where the gaps are, what to do about them, and how to track progress.”
“I need to break down gaps by role, level, gender, but the current tool does not allow.
“Our goal is to be fair, but I can not advocate for change without clear visuals that leadership can trust and act on.”
Empathy Mapping
Empathy Mapping
Empathy Mapping
Empathy map helped me to understand the thoughts, feelings, and challenges of HR professionals dealing with pay equity, enabling the team to align on user needs and design a solution rooted in real workplace experiences.
Empathy map helped me to understand the thoughts, feelings, and challenges of HR professionals dealing with pay equity, enabling the team to align on user needs and design a solution rooted in real workplace experiences.
Empathy map helped me to understand the thoughts, feelings, and challenges of HR professionals dealing with pay equity, enabling the team to align on user needs and design a solution rooted in real workplace experiences.
“It’s hard to trust data from so many sources.”
“Even if I find a gap, I don’t know the best way to fix it.”
“I need to be compliant with regulations.”
Says
Says
Does
Sends unclear reports to leadership or delays action
Avoids making changes due to uncertainty or legal fear
Manually collects data from multiple HR systems
Thinks
“There must be an easier way to see and fix pay gaps.”
“I’m afraid I’ll misinterpret the data and cause a legal issue.”
“Am I missing any major gap in pay?”
Feels
Pressured to show progress on pay equity but unsure how
Hesitant or insecure about taking action
Overwhelmed by messy or incomplete data
Does
Sends unclear reports to leadership or delays action
Avoids making changes due to uncertainty or legal fear
Manually collects data from multiple HR systems
“There must be an easier way to see and fix pay gaps.”
“I’m afraid I’ll misinterpret the data and cause a legal issue.”
“Am I missing any major gap in pay?”
Thinks
Feels
Pressured to show progress on pay equity but unsure how
Hesitant or insecure about taking action
Overwhelmed by messy or incomplete data
“It’s hard to trust data from so many sources.”
“Even if I find a gap, I don’t know the best way to fix it.”
“I need to be compliant with regulations.”
Says
Does
Sends unclear reports to leadership or delays action
Avoids making changes due to uncertainty or legal fear
Manually collects data from multiple HR systems
“There must be an easier way to see and fix pay gaps.”
“I’m afraid I’ll misinterpret the data and cause a legal issue.”
“Am I missing any major gap in pay?”
Thinks
Feels
Pressured to show progress on pay equity but unsure how
Hesitant or insecure about taking action
Overwhelmed by messy or incomplete data
User Pain Points
User Pain Points
User Pain Points
These are key pain points which we uncovered, These points shaped our design priorities and helped us focus on clarity, actionability, and trust.
These are key pain points which we uncovered, These points shaped our design priorities and helped us focus on clarity, actionability, and trust.
These are key pain points which we uncovered, These points shaped our design priorities and helped us focus on clarity, actionability, and trust.

Scattered and Inconsistent Data
HR professionals takes compensation data from multiple sources, which makes hard to get a complete and accurate data.
Lack of visibility into pay gaps
Many tools do not highlight where gap exists, which leaves HR teams to manually compare roles, departments, and demographics.
Fear of Legal Risk
Users hesitate to act, because of legal consequences and organizational backlash from misinterpreting sensitive equity data.

Complex tools
Existing systems are not built for HR users, requires data expertise or external consultants to interpret results.

Inability to act
Even when gaps are found, there is little guidance on how to address them, makes it hard to present solutions to leadership or take clear next steps.
Communicate Findings to Leadership
HR teams struggle to translate pay equity insights into simple, executive ready reports. This leads to delays in decision making.
Scattered and Inconsistent Data
Scattered and Inconsistent Data
HR professionals takes compensation data from multiple sources, which makes hard to get a complete and accurate data.
HR professionals takes compensation data from multiple sources, which makes hard to get a complete and accurate data.
Lack of visibility into pay gaps
Lack of visibility into pay gaps
Many tools do not highlight where gap exists, which leaves HR teams to manually compare roles, departments, and demographics.
Many tools do not highlight where gap exists, which leaves HR teams to manually compare roles, departments, and demographics.
Fear of Legal Risk
Fear of Legal Risk
Users hesitate to act, because of legal consequences and organizational backlash from misinterpreting sensitive equity data.
Users hesitate to act, because of legal consequences and organizational backlash from misinterpreting sensitive equity data.
Complex tools
Complex tools
Existing systems are not built for HR users, requires data expertise or external consultants to interpret results.
Existing systems are not built for HR users, requires data expertise or external consultants to interpret results.
Inability to act
Inability to act
Even when gaps are found, there is little guidance on how to address them, makes it hard to present solutions to leadership or take clear next steps.
Even when gaps are found, there is little guidance on how to address them, makes it hard to present solutions to leadership or take clear next steps.
Communicate Findings to Leadership
Communicate Findings to Leadership
HR teams struggle to translate pay equity insights into simple, executive ready reports. This leads to delays in decision making.
HR teams struggle to translate pay equity insights into simple, executive ready reports. This leads to delays in decision making.
Scattered and Inconsistent Data
HR professionals takes compensation data from multiple sources, which makes hard to get a complete and accurate data.
Lack of visibility into pay gaps
Many tools do not highlight where gap exists, which leaves HR teams to manually compare roles, departments, and demographics.
Fear of Legal Risk
Users hesitate to act, because of legal consequences and organizational backlash from misinterpreting sensitive equity data.
Complex tools
Existing systems are not built for HR users, requires data expertise or external consultants to interpret results.
Inability to act
Even when gaps are found, there is little guidance on how to address them, makes it hard to present solutions to leadership or take clear next steps.
Communicate Findings to Leadership
HR teams struggle to translate pay equity insights into simple, executive ready reports. This leads to delays in decision making.
User Persona
User Persona
User Persona
Meet Christina, a senior HR Management partner who is committed to fairness but feels overwhelmed by complex tools. She needs a clear, actionable view of pay equity, so she can support leadership and drive meaningful change.
Meet Christina, a senior HR Management partner who is committed to fairness but feels overwhelmed by complex tools. She needs a clear, actionable view of pay equity, so she can support leadership and drive meaningful change.
Meet Christina, a senior HR Management partner who is committed to fairness but feels overwhelmed by complex tools. She needs a clear, actionable view of pay equity, so she can support leadership and drive meaningful change.


Competitive Analysis
Competitive Analysis
Competitive Analysis
To understand how leading pay equity platforms serve real HR users, so we can design a smarter, more empathetic solution at Korn Ferry.
To understand how leading pay equity platforms serve real HR users, so we can design a smarter, more empathetic solution at Korn Ferry.
To understand how leading pay equity platforms serve real HR users, so we can design a smarter, more empathetic solution at Korn Ferry.


Key User Stories
Key User Stories
Key User Stories
Translated user needs into focused user stories across core feature of the Pay Equity tool. These stories helped me to prioritize functionality that solves real pain points.
Translated user needs into focused user stories across core feature of the Pay Equity tool. These stories helped me to prioritize functionality that solves real pain points.
Translated user needs into focused user stories across core feature of the Pay Equity tool. These stories helped me to prioritize functionality that solves real pain points.

Key Findings & Opportunities
Key Findings & Opportunities
Key Findings & Opportunities
By synthesizing user research and mapping pain points, we identified critical moments where users felt unsupported. These insights revealed clear opportunities to create value by enhancing clarity. and building trust.
By synthesizing user research and mapping pain points, we identified critical moments where users felt unsupported. These insights revealed clear opportunities to create value by enhancing clarity. and building trust.

User Journey Map
User Journey Map
User Journey Map
I mapped the journey of HR professionals from login to pay gap analysis and planning. This revealed key pain points like data overload and unclear next steps, helping us design a more focused, supportive, and action driven experience.
I mapped the journey of HR professionals from login to pay gap analysis and planning. This revealed key pain points like data overload and unclear next steps, helping us design a more focused, supportive, and action driven experience.
I mapped the journey of HR professionals from login to pay gap analysis and planning. This revealed key pain points like data overload and unclear next steps, helping us design a more focused, supportive, and action driven experience.
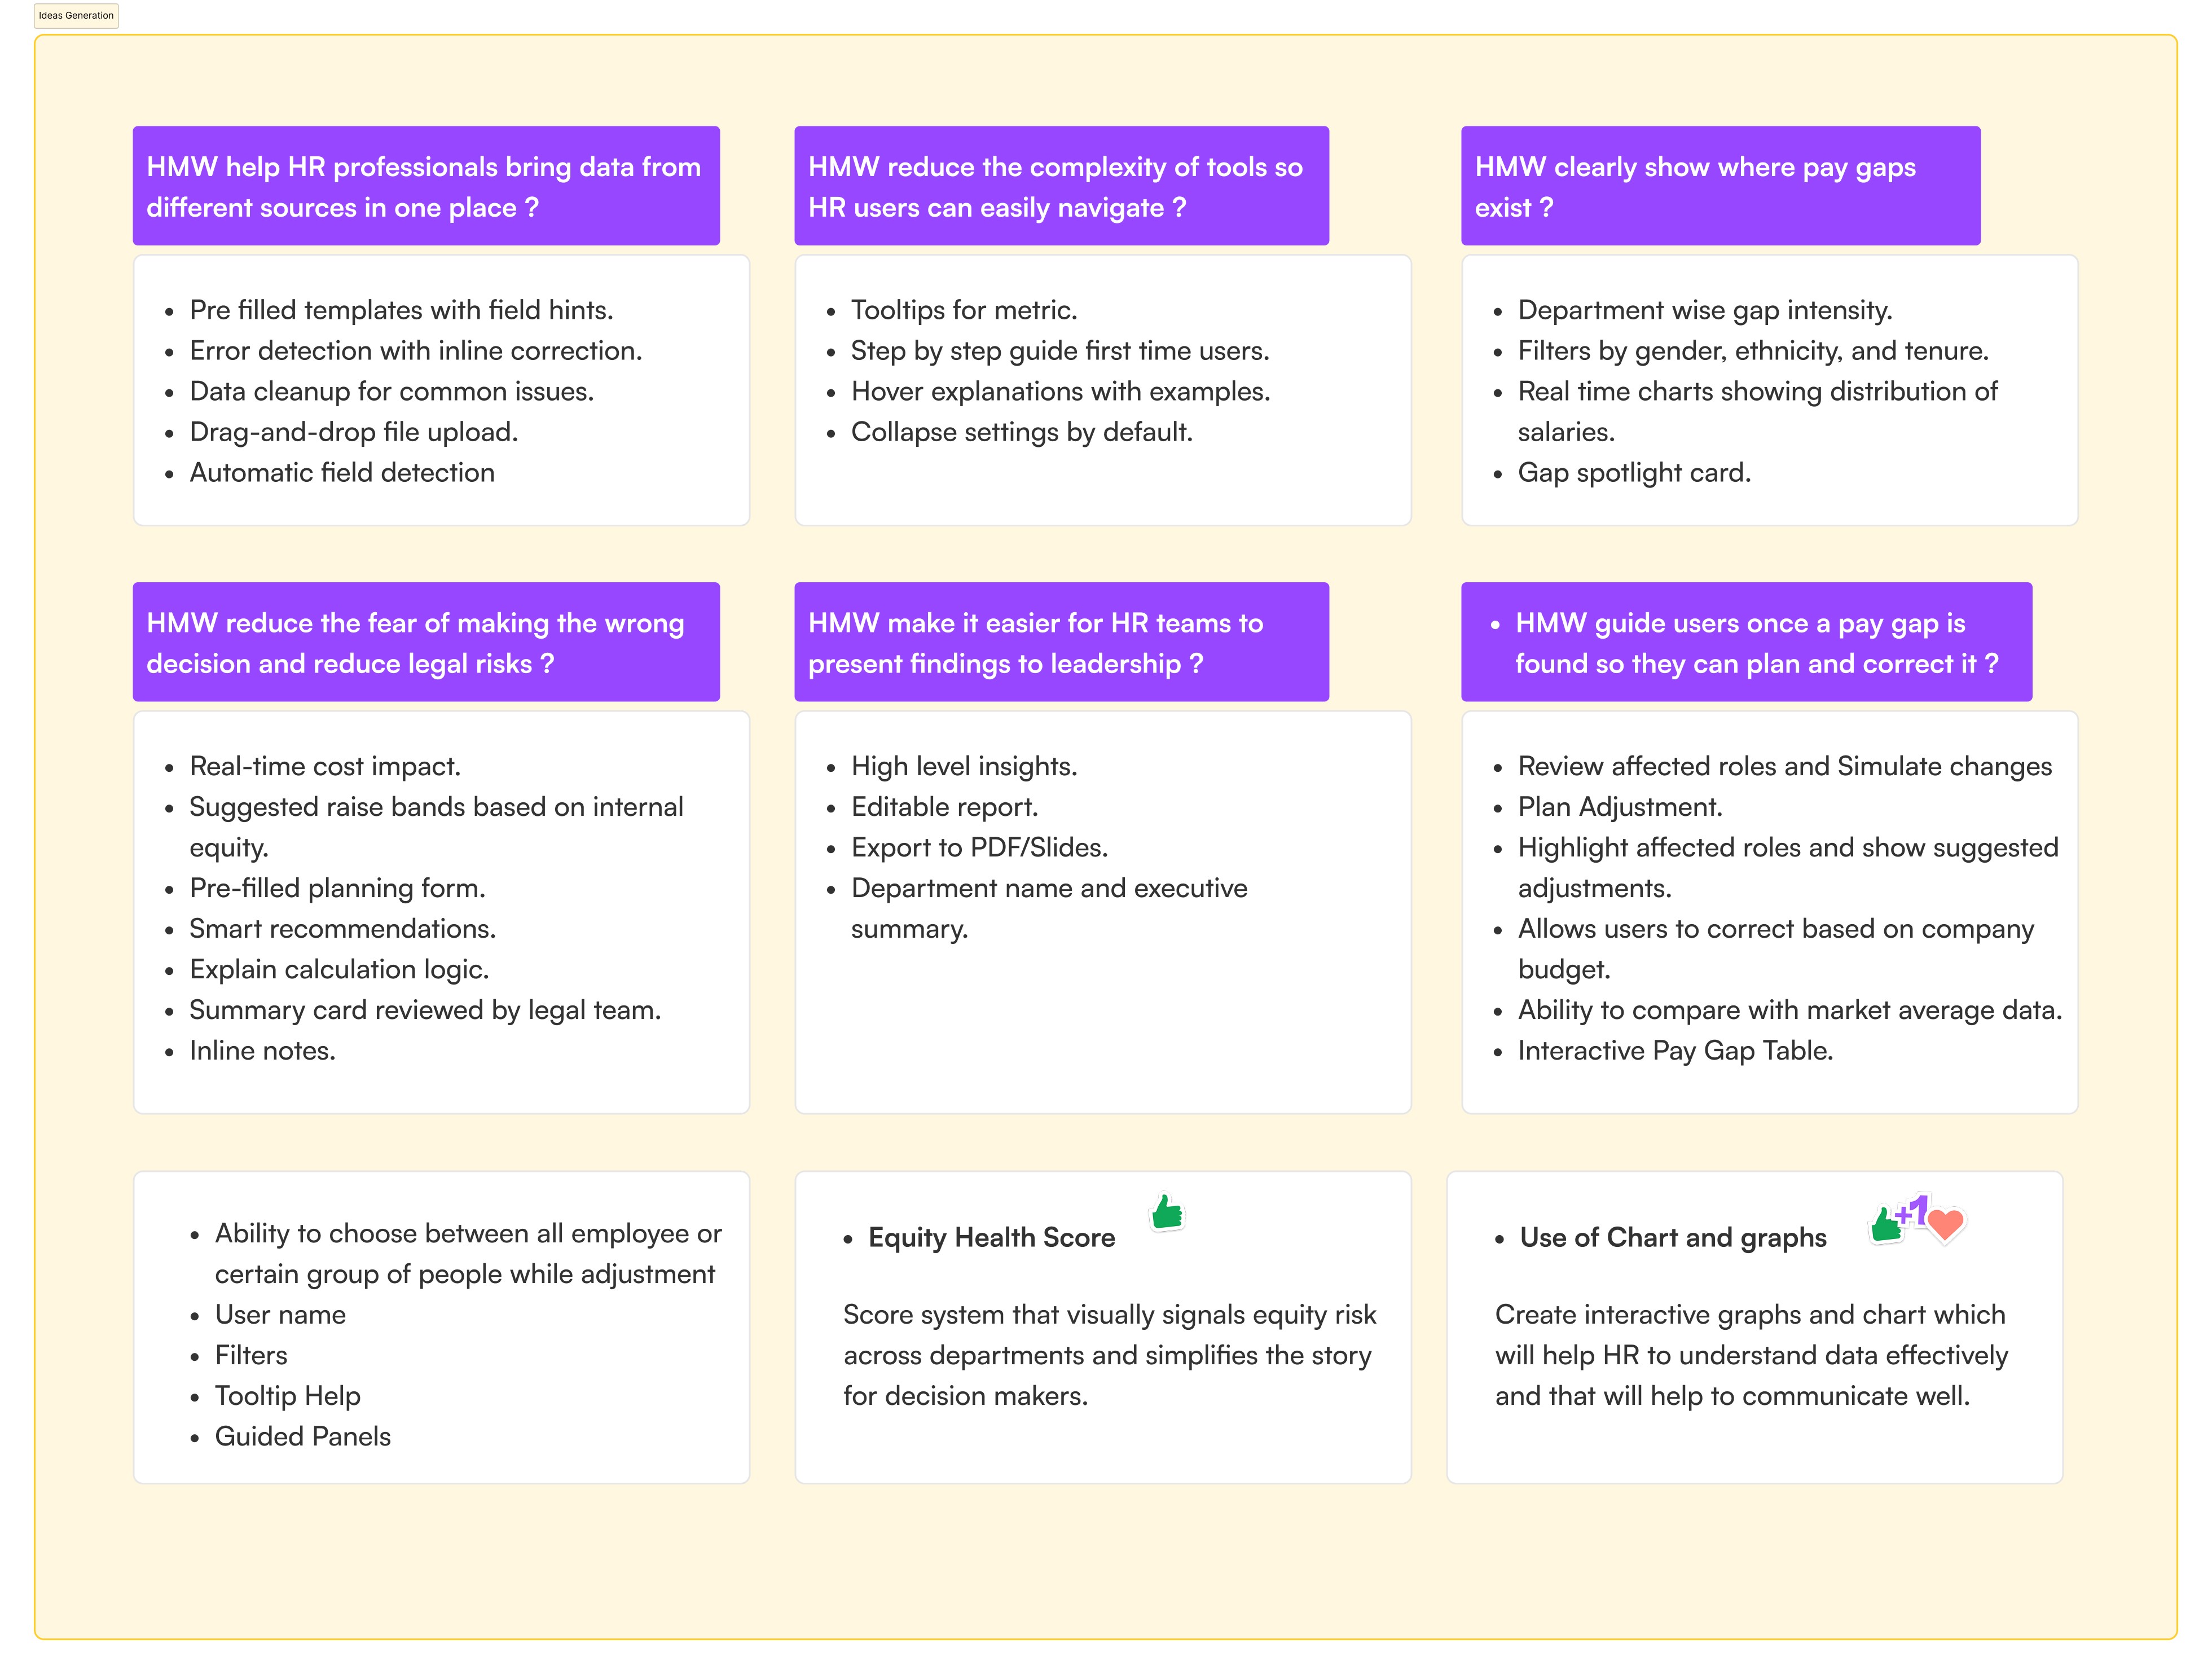
Generating Ideas
Generating Ideas
From real challenges to real ideas, each concept in this section directly addresses a pain point uncovered during user research. These ideas laid the foundation for designing solutions that are practical, easy to use, and genuinely helpful for HR professionals working on pay equity.
From real challenges to real ideas, each concept in this section directly addresses a pain point uncovered during user research. These ideas laid the foundation for designing solutions that are practical, easy to use, and genuinely helpful for HR professionals working on pay equity.
Generating Ideas
From real challenges to real ideas, each concept in this section directly addresses a pain point uncovered during user research. These ideas laid the foundation for designing solutions that are practical, easy to use, and genuinely helpful for HR professionals working on pay equity.
Feature Prioritization
Feature Prioritization
Feature Prioritization
To ensure we built a solution that solved real problems without overwhelming users, used the MoSCoW method to prioritize features. This helped us focus on core needs like pay gap visibility and planning tools, while deferring non-essential ideas for future releases.
To ensure we built a solution that solved real problems without overwhelming users, used the MoSCoW method to prioritize features. This helped us focus on core needs like pay gap visibility and planning tools, while deferring non essential ideas for future releases.
To ensure we built a solution that solved real problems without overwhelming users, used the MoSCoW method to prioritize features. This helped us focus on core needs like pay gap visibility and planning tools, while deferring non-essential ideas for future releases.

User Flow
User Flow
User Flow
To ensure a smooth experience, designed a clear user flow that helps HR professionals easily identify, analyze, and act on pay equity data. with minimal friction.
To ensure a smooth experience, designed a clear user flow that helps HR professionals easily identify, analyze, and act on pay equity data. with minimal friction.
To ensure a smooth experience, designed a clear user flow that helps HR professionals easily identify, analyze, and act on pay equity data. with minimal friction.

Wireframe/Sketch creation
After mapping the user flow, multiple team discussions, and iterative sketching sessions, I translated the concept into a structured wireframe to visualize the core experience and layout.
Dashboard Overview
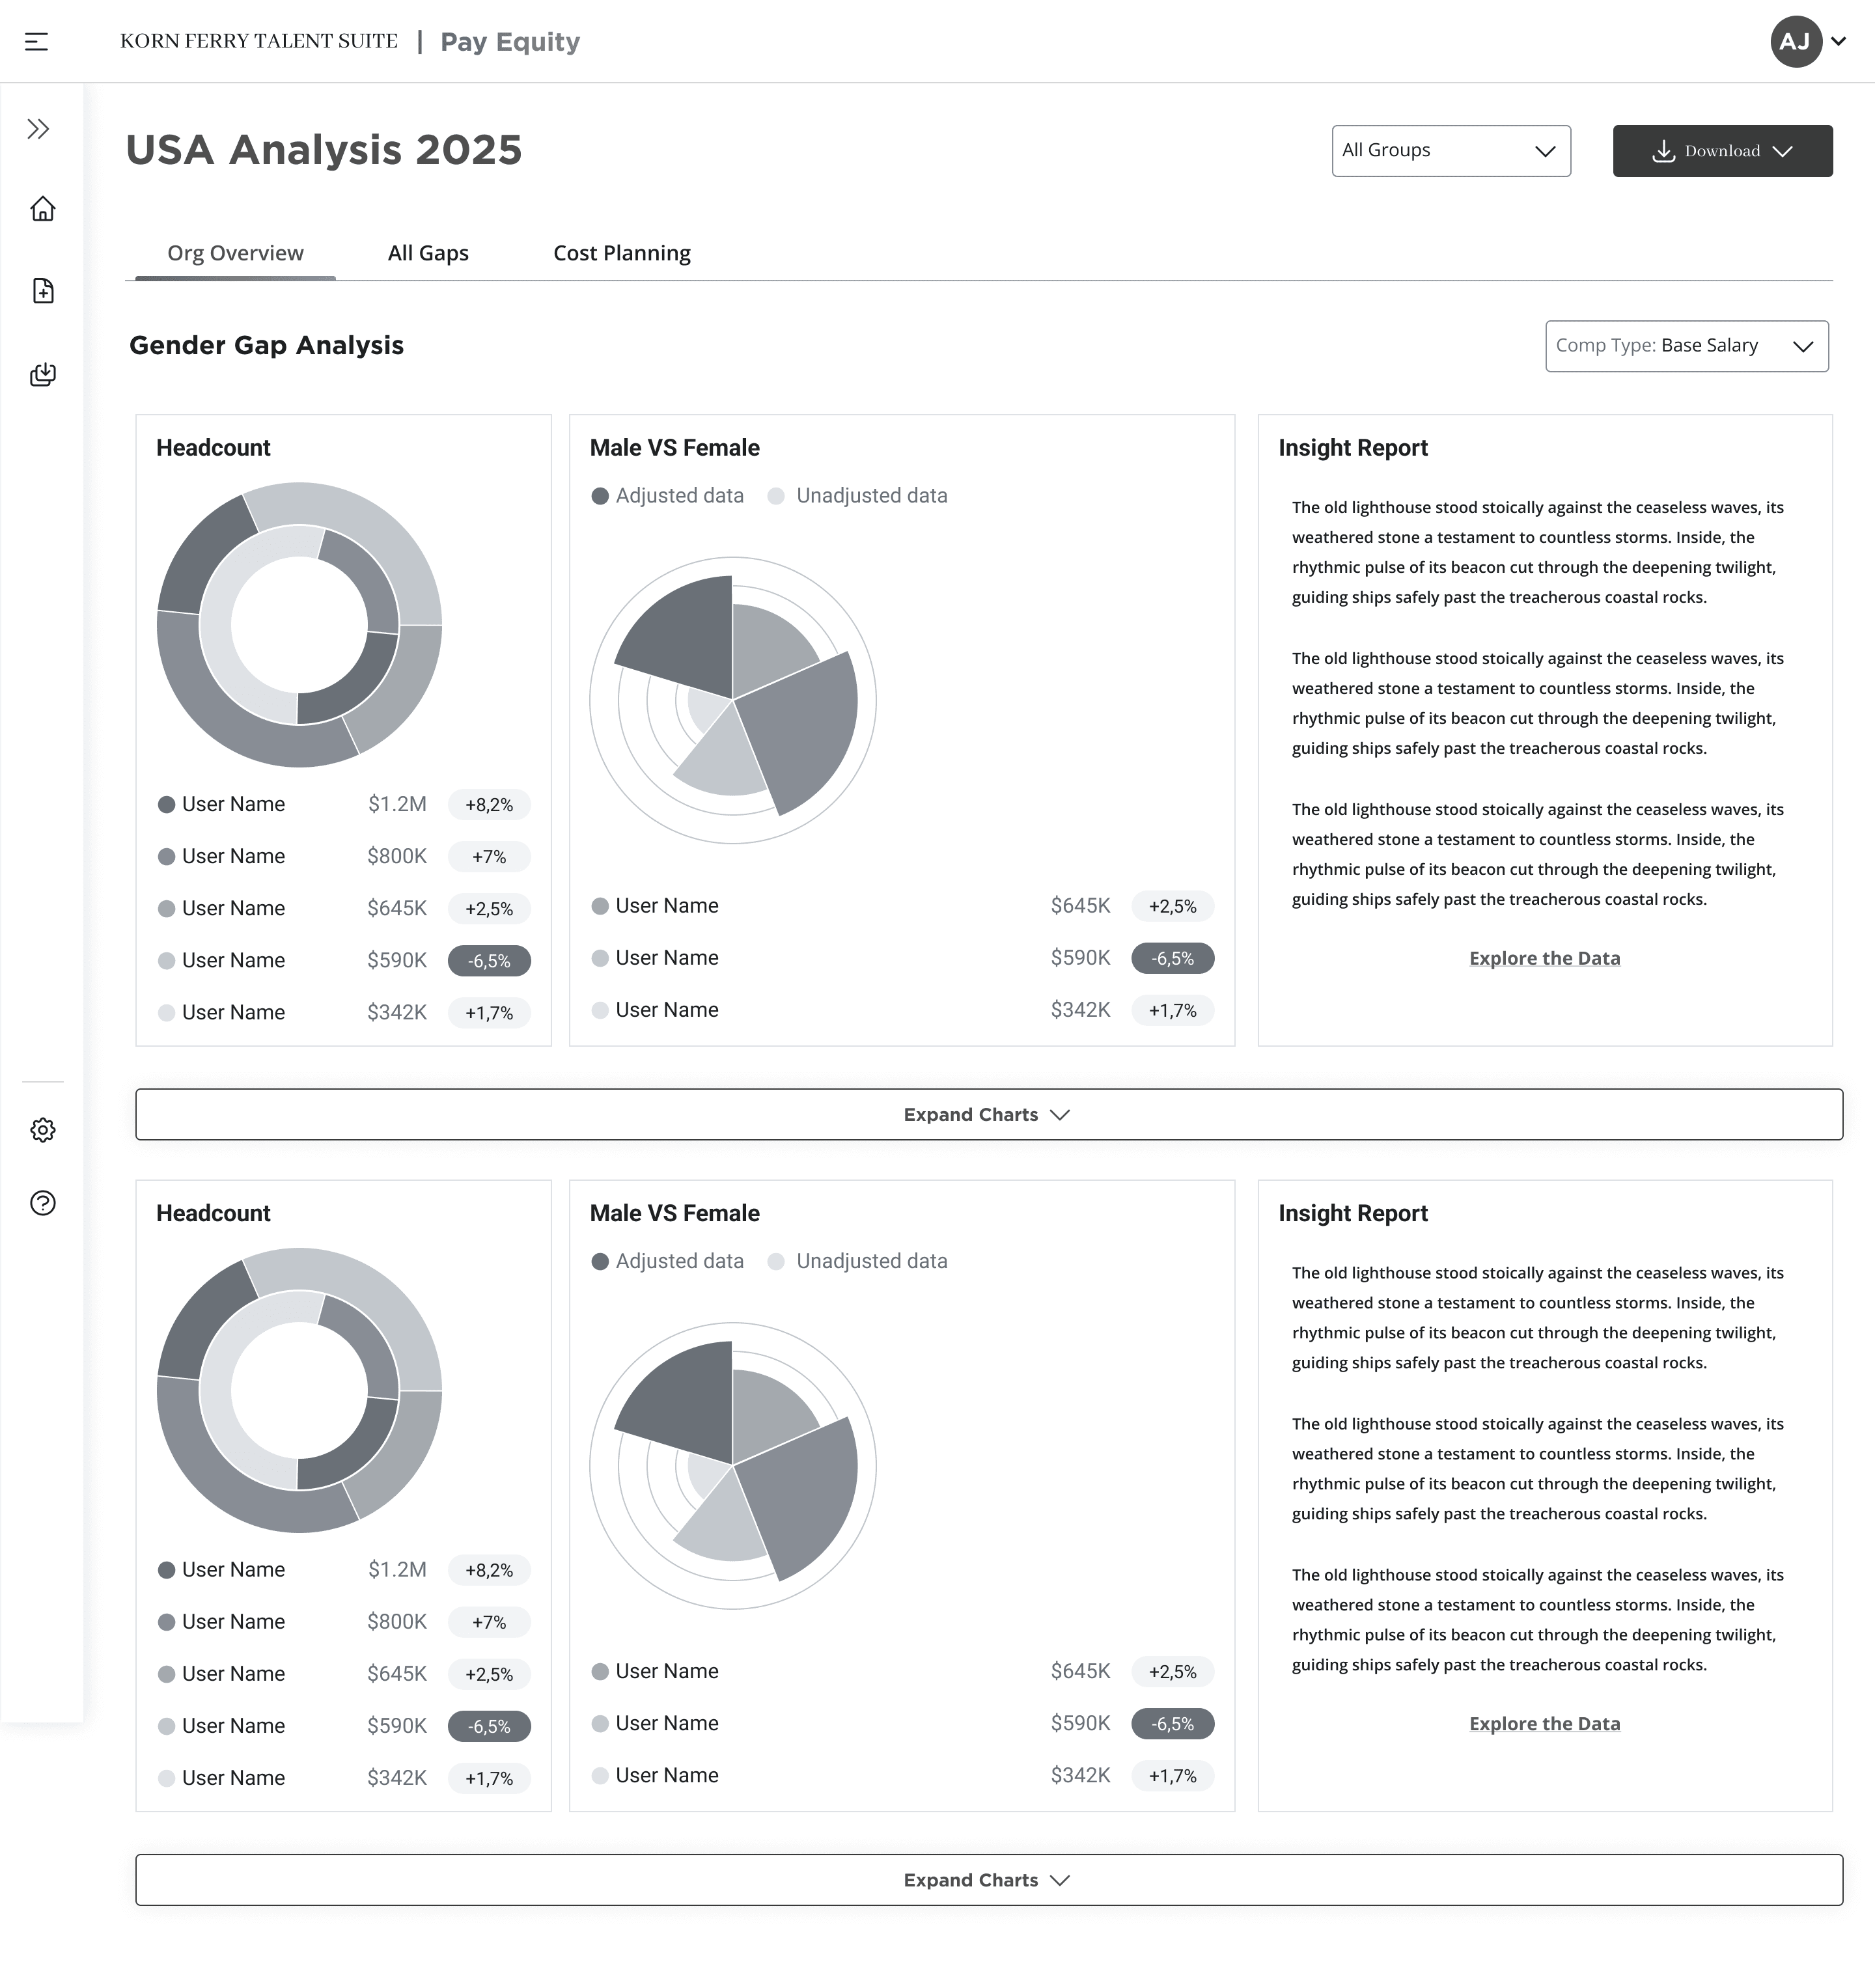
Dashboard Overview- Expand View
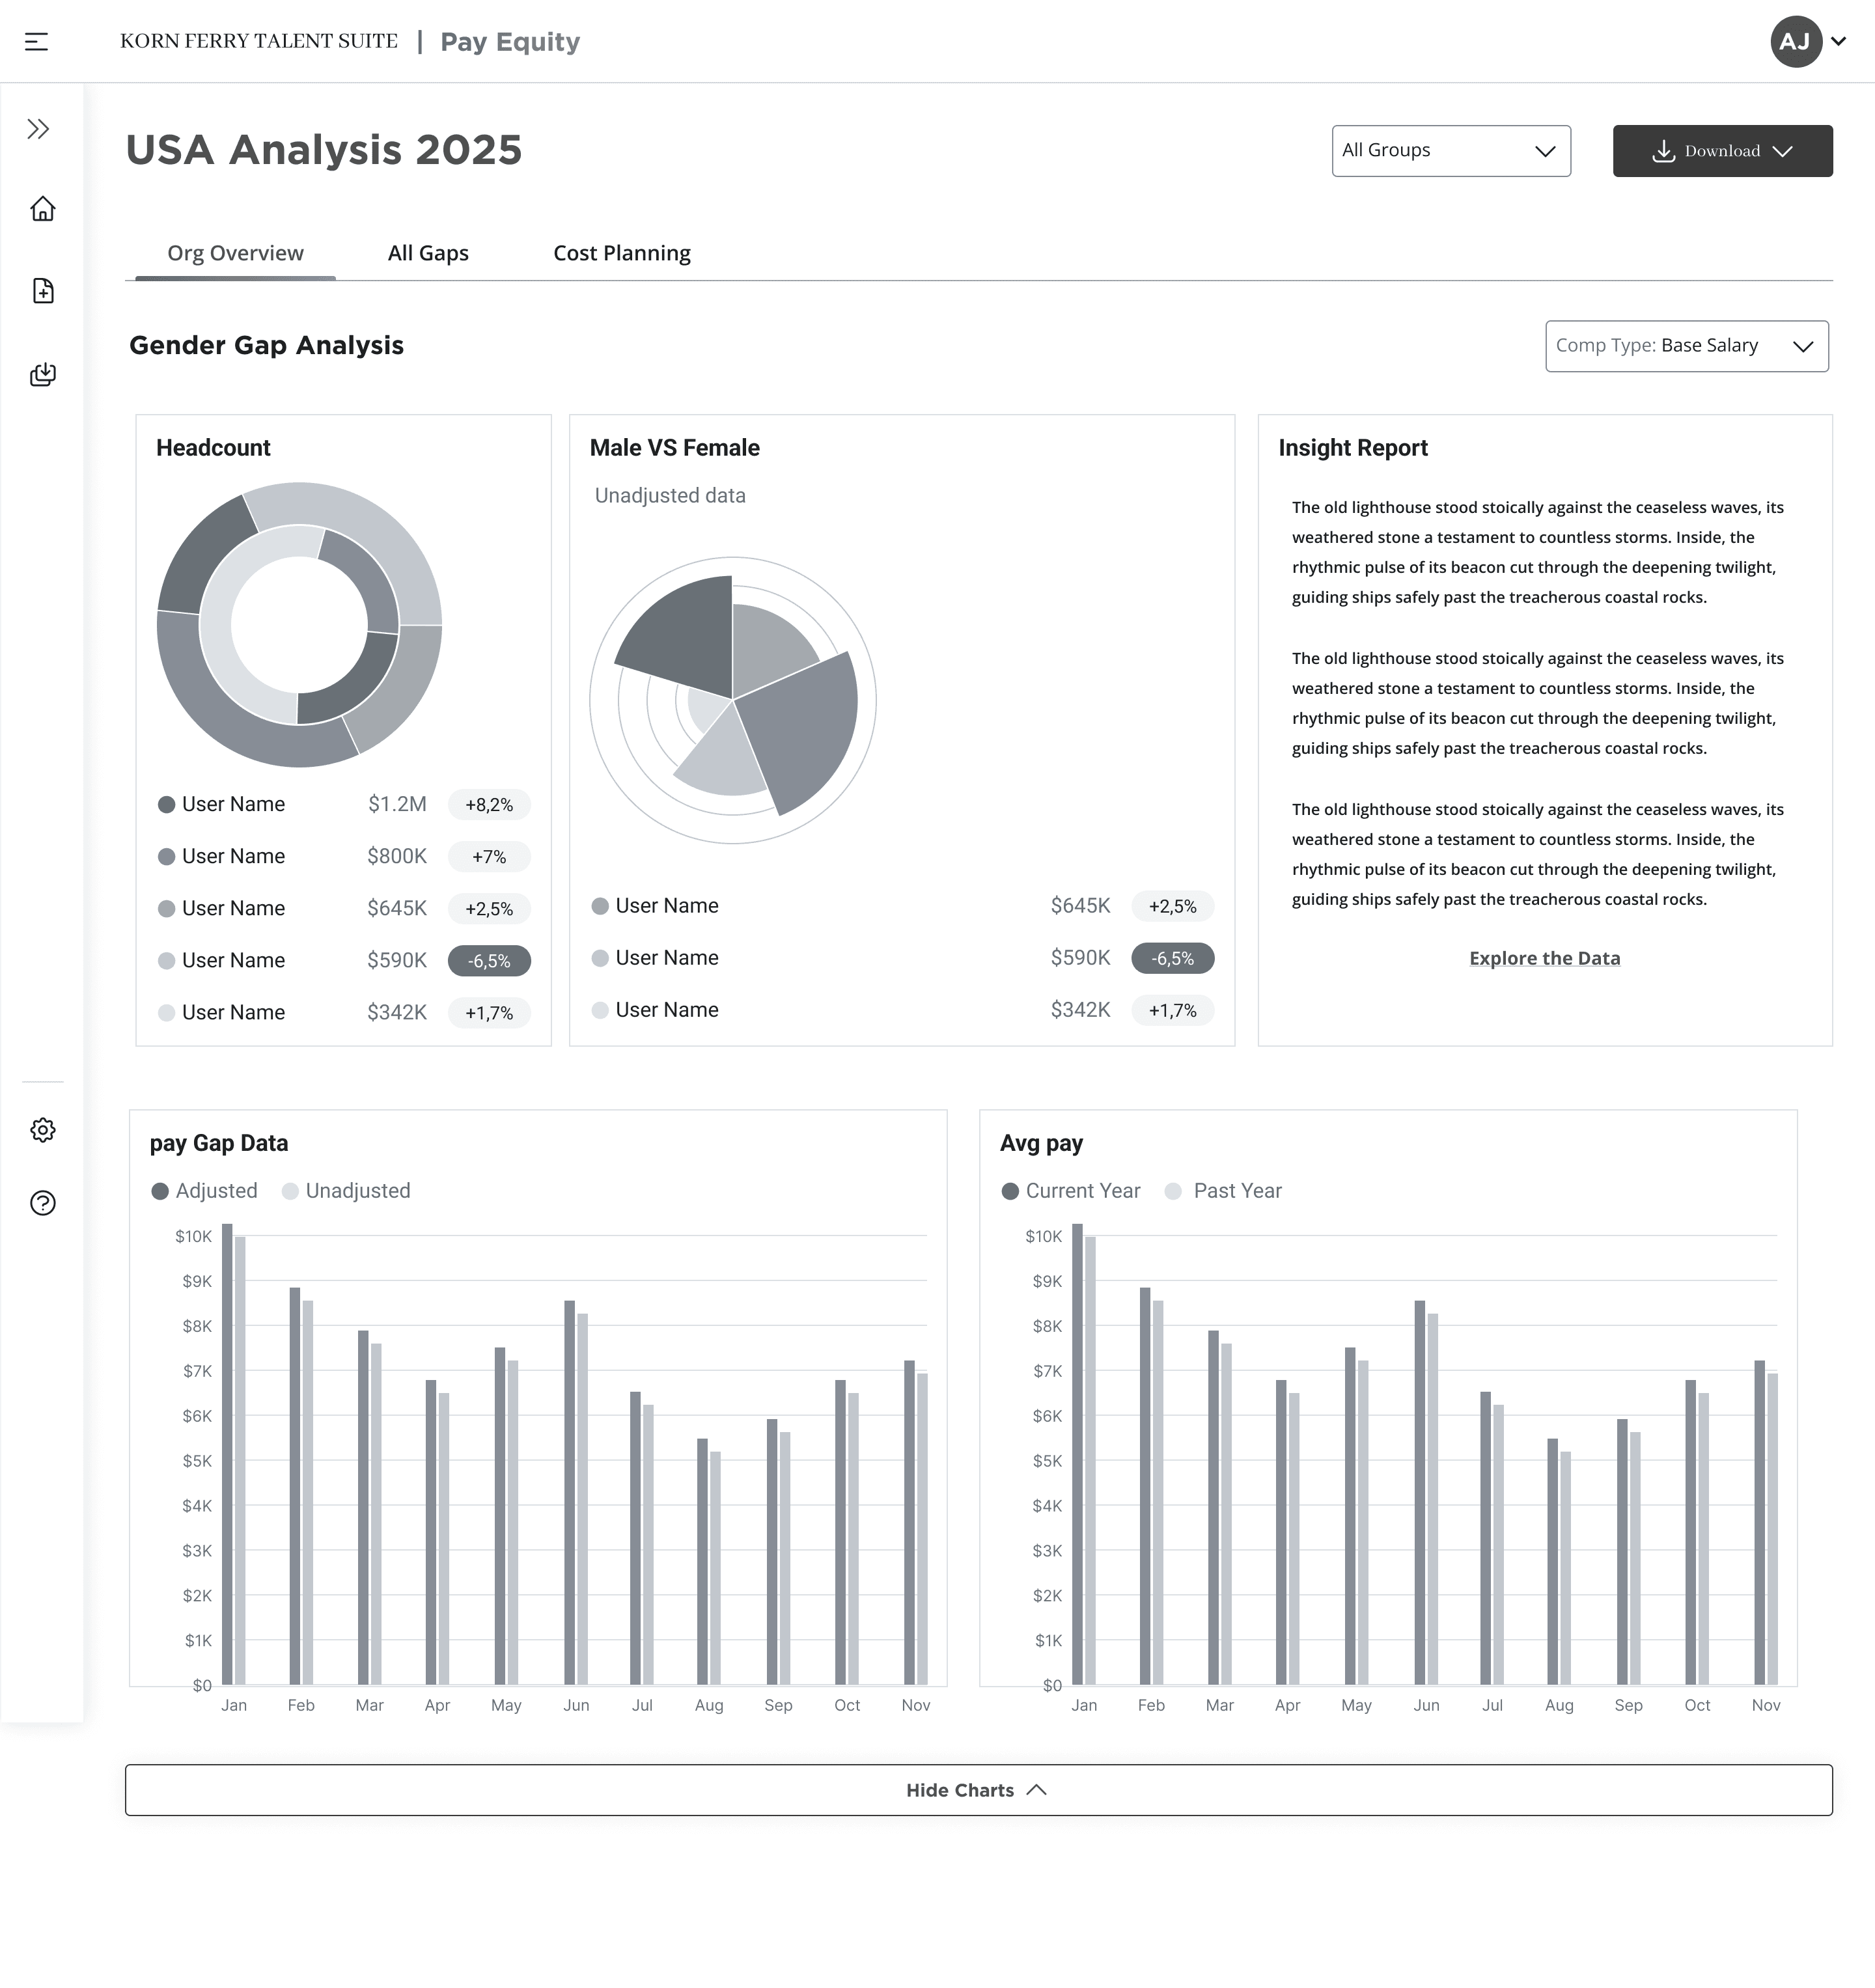
All Pay Gap view
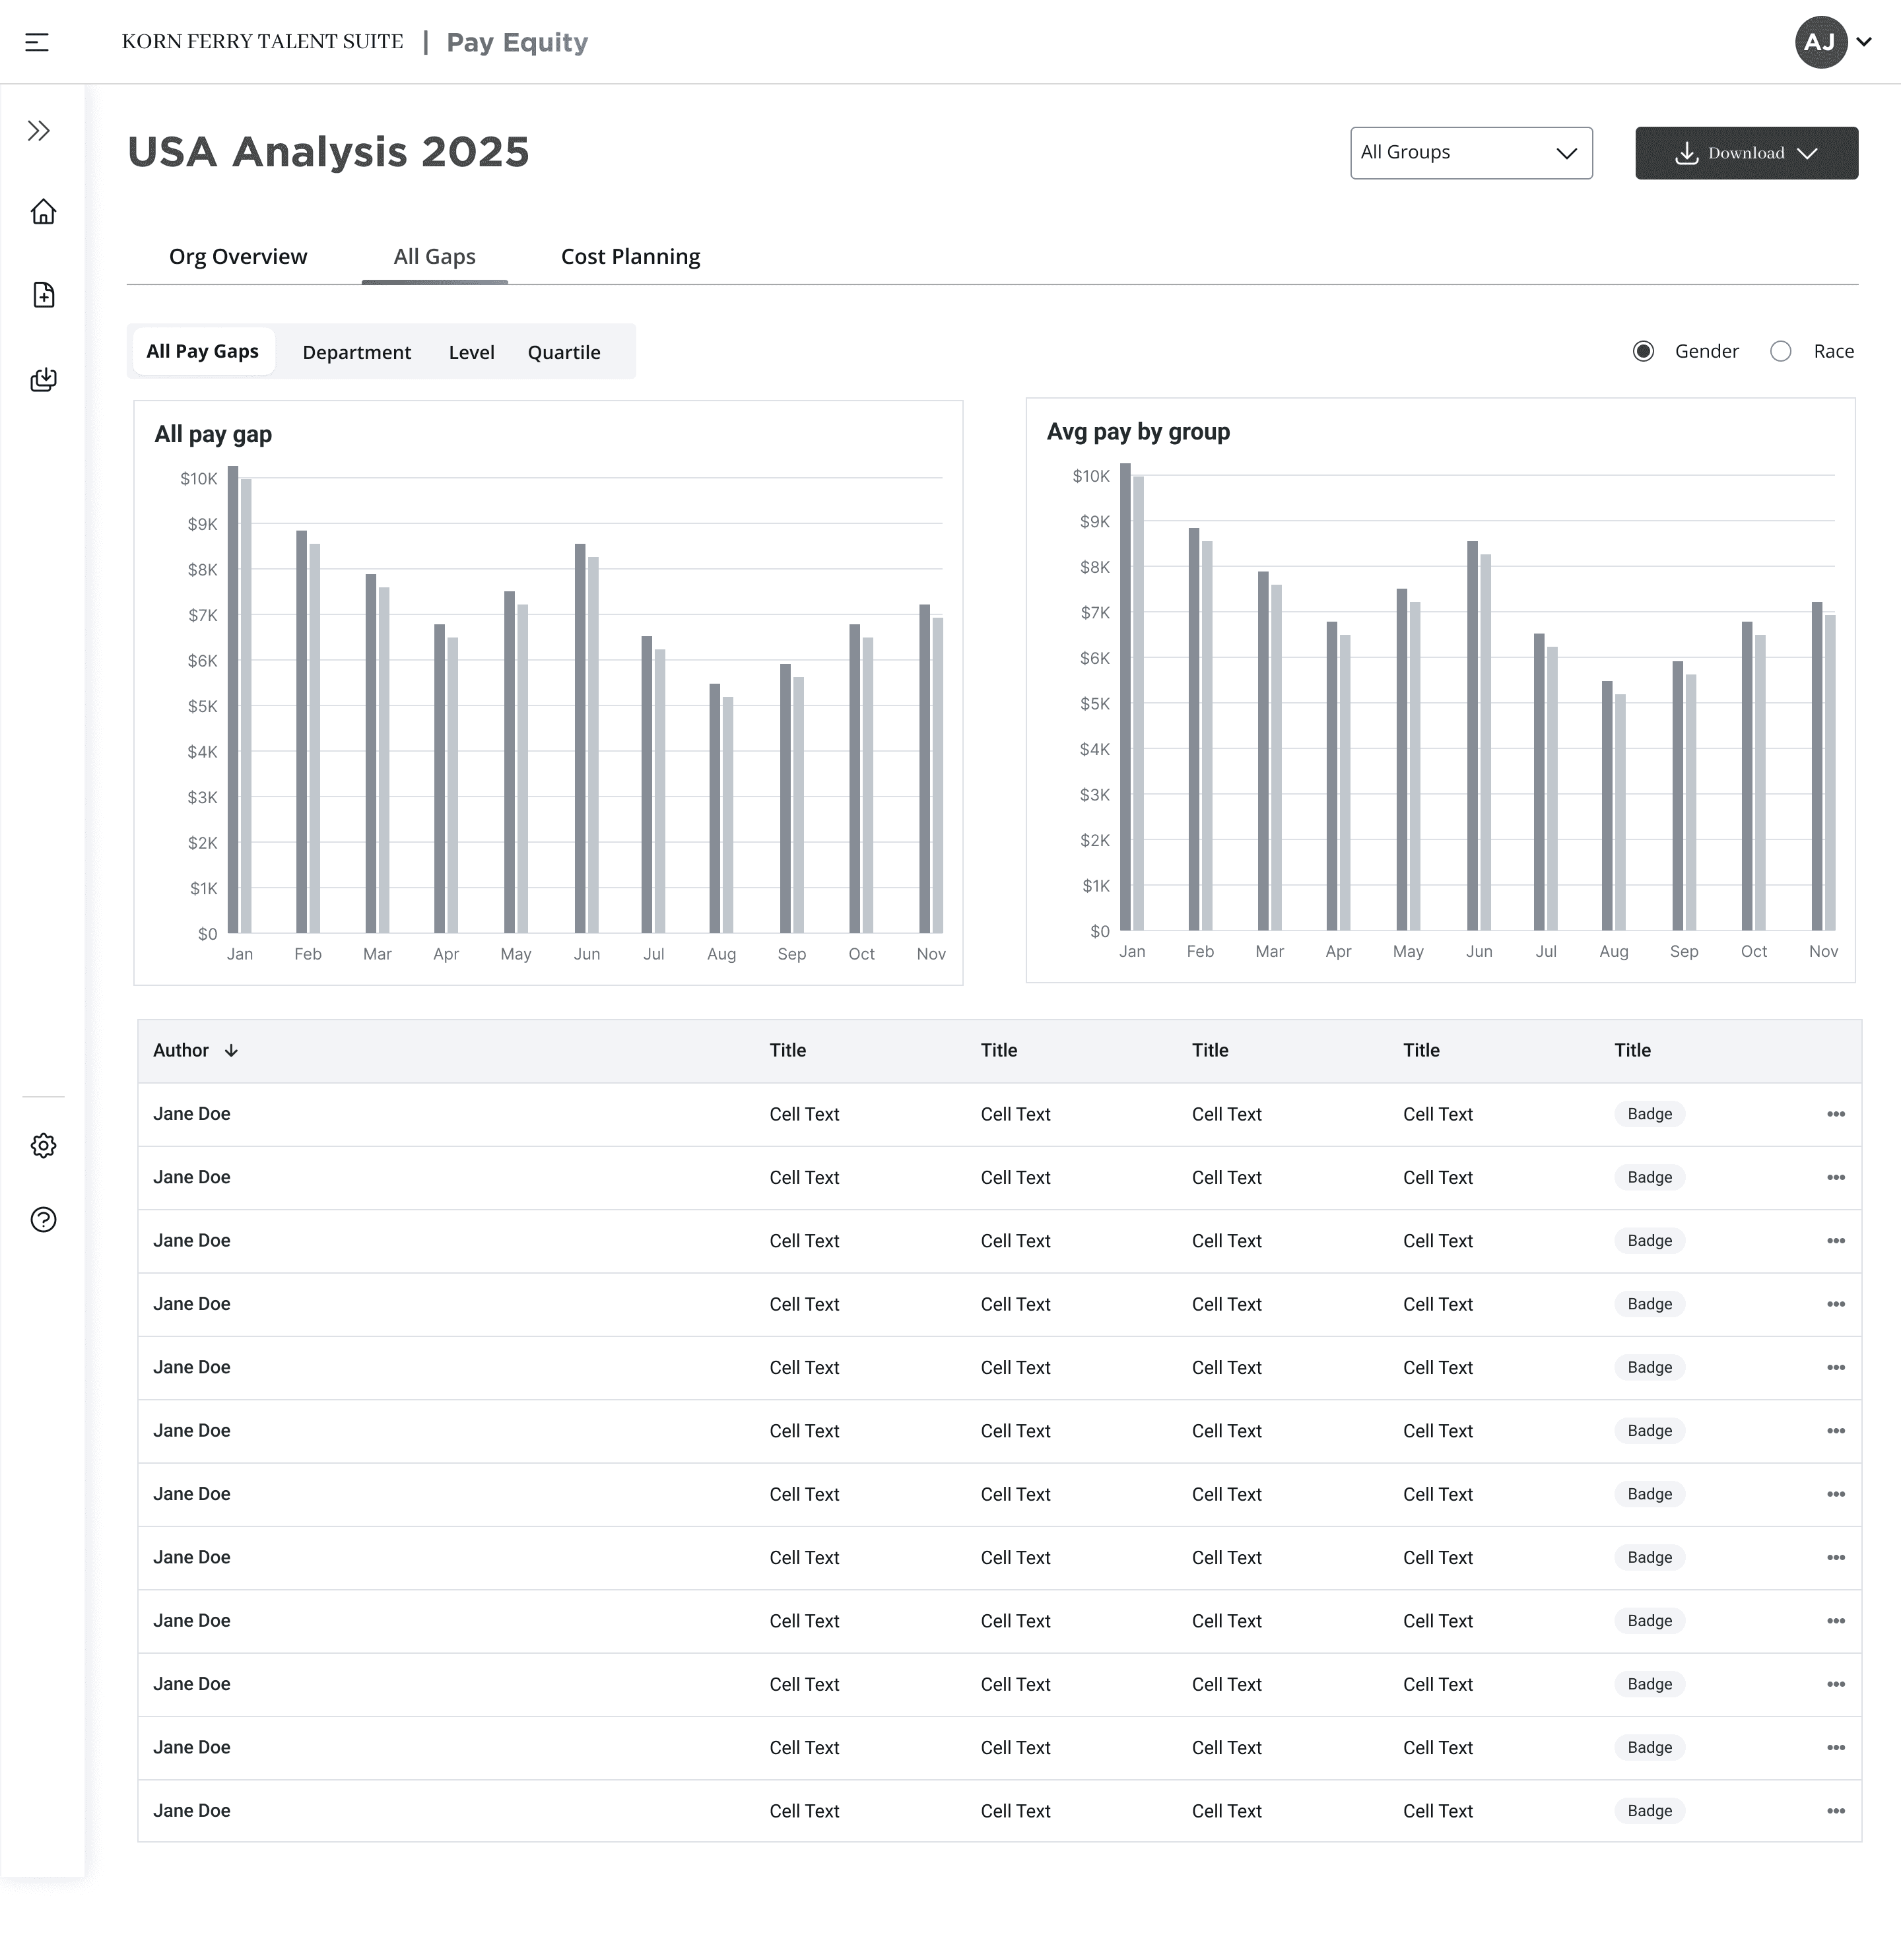
All Pay Gap- Department view
All Pay Gap- Level view

All Pay Gap- Quartile view
Design Components
Design Components
This section showcases the foundational design elements like colors, typography, and reusable UI components that helped me to maintain visual consistency and scalability across the product experience.
This section showcases the foundational design elements like colors, typography, and reusable UI components that helped me to maintain visual consistency and scalability across the product experience.


Wireframe/Sketch creation
Wireframe/Sketch creation
After mapping the user flow, multiple team discussions, and iterative sketching sessions, I translated the concept into a structured wireframe to visualize the core experience and layout.
After mapping the user flow, multiple team discussions, and iterative sketching sessions, I translated the concept into a structured wireframe to visualize the core experience and layout.
Dashboard Overview
Dashboard Overview- Expand View
All Pay Gap view
All Pay Gap- Department view
All Pay Gap- Level view
All Pay Gap- Quartile view
Dashboard Overview
Dashboard Overview- Expand View
All Pay Gap view
All Pay Gap- Department view
All Pay Gap- Level view
All Pay Gap- Quartile view
Design Components
Design Components
This section showcases the foundational design elements like colors, typography, and reusable UI components that helped me to maintain visual consistency and scalability across the product experience.
This section showcases the foundational design elements like colors, typography, and reusable UI components that helped me to maintain visual consistency and scalability across the product experience.
Transforming Insight into Impact
Transforming Insight into Impact
Transforming Insight into Impact
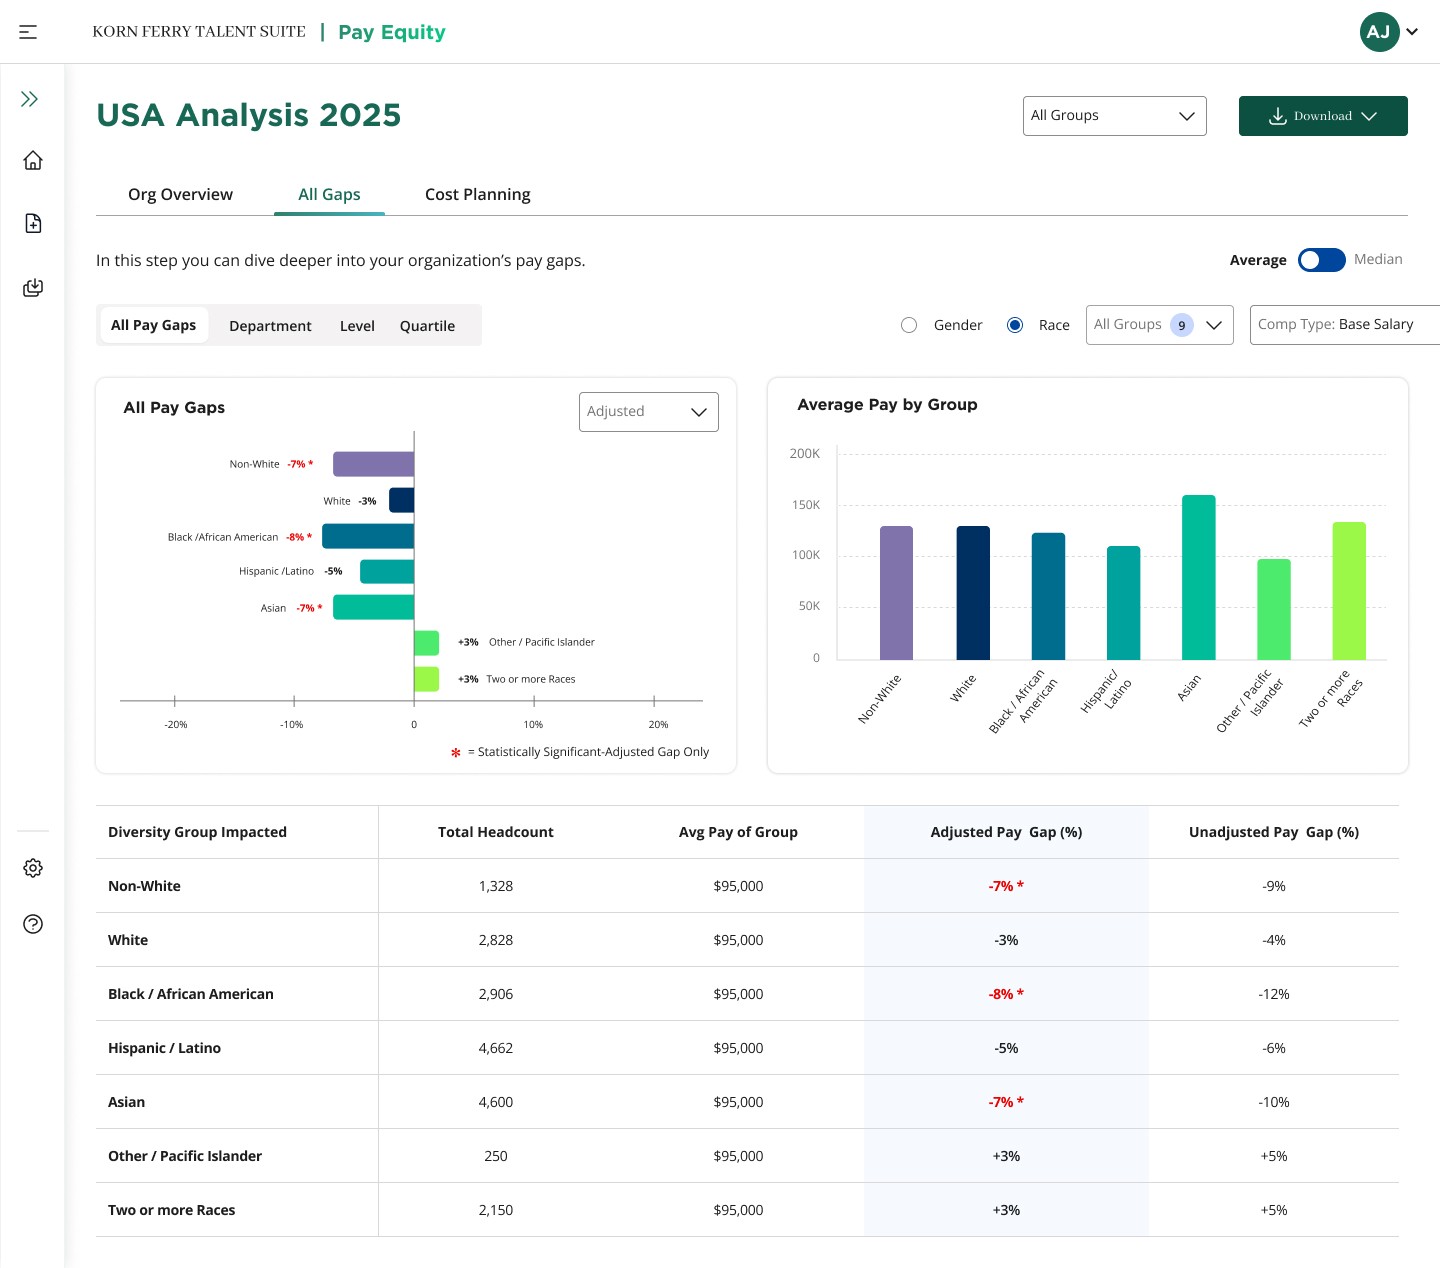
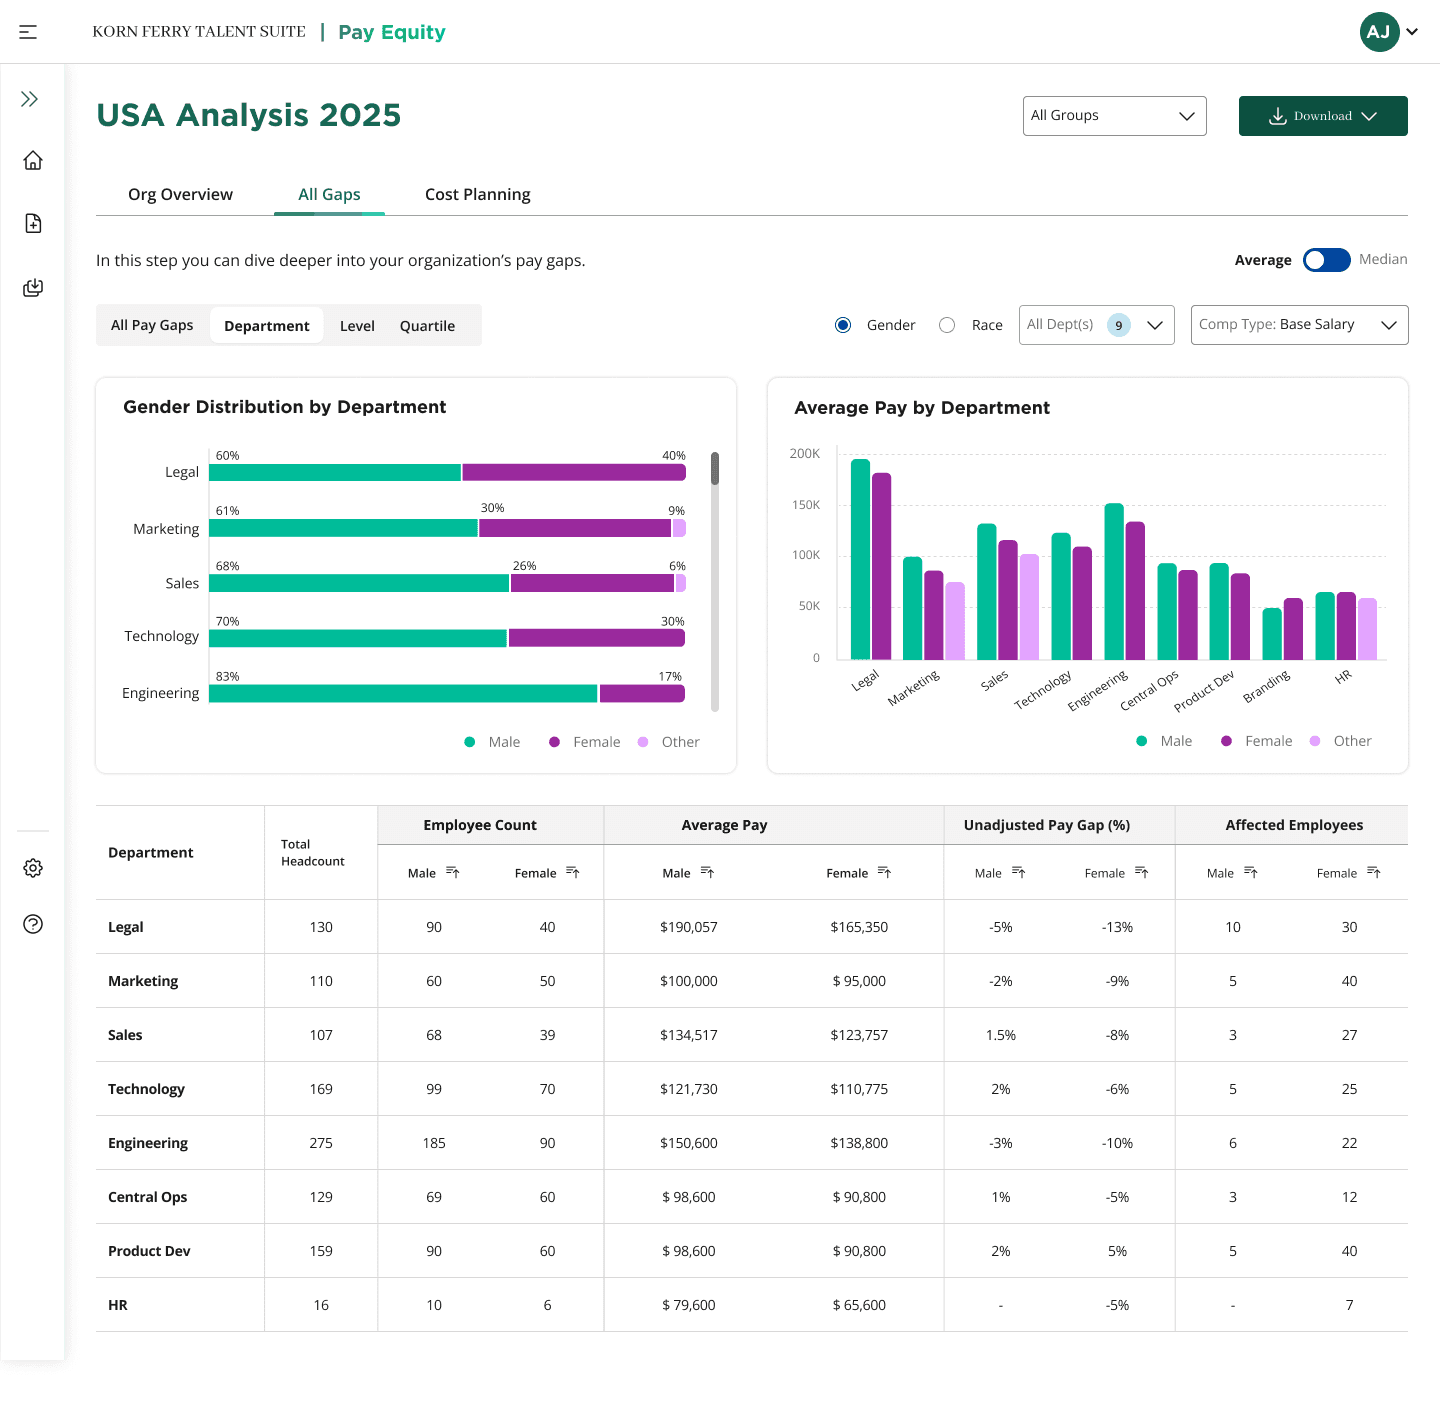
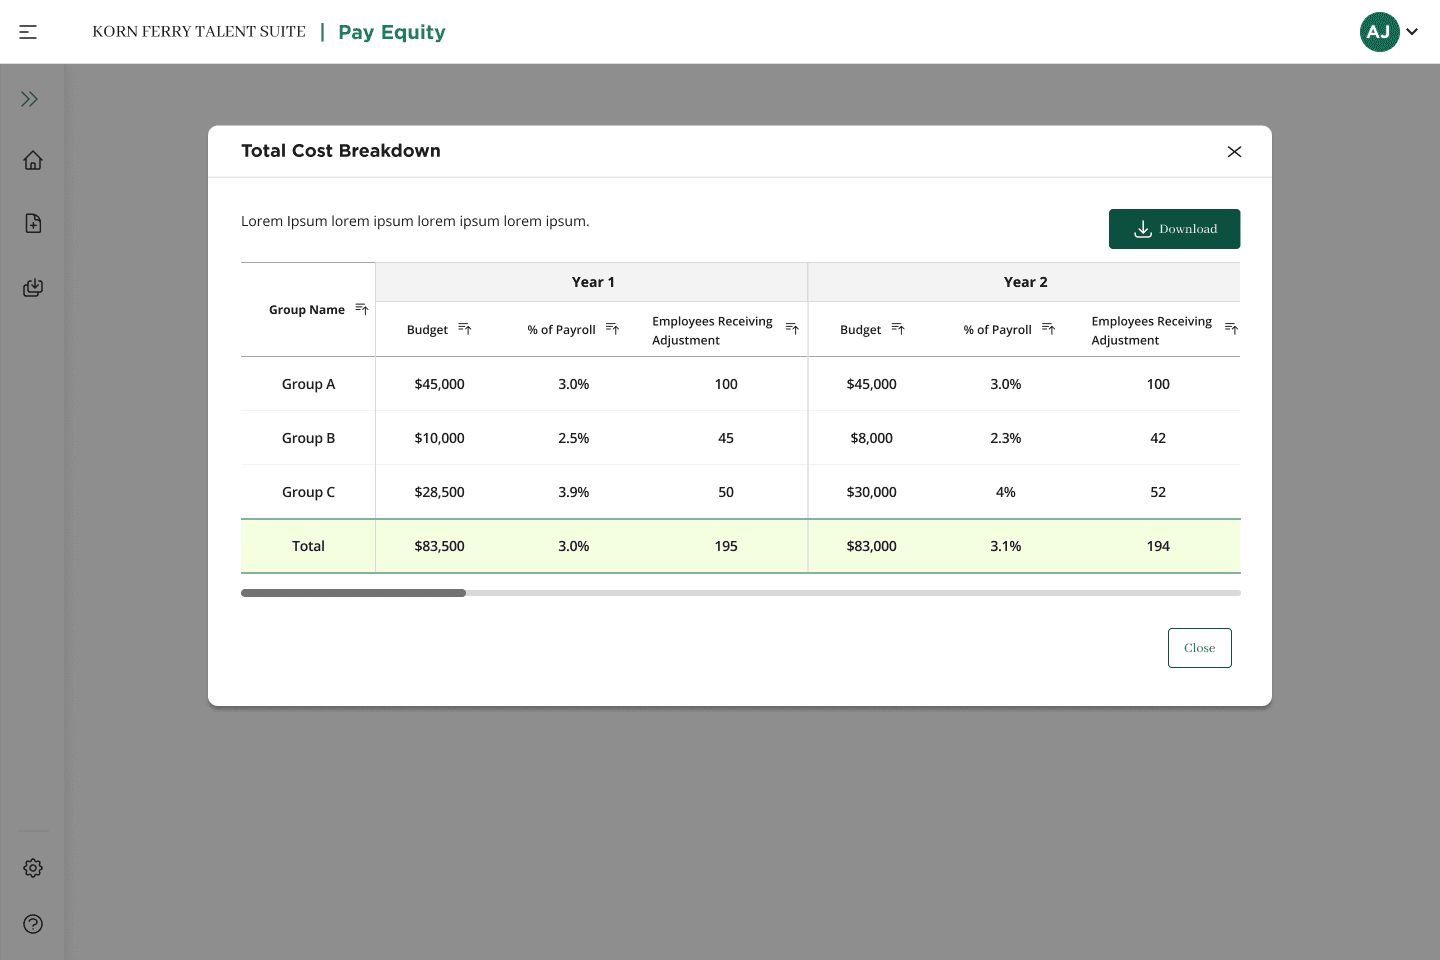
I made each design decision based on user feedback and real data challenges. This screen shows how I structured information from gap insights to cost planning, so HR teams can easily understand the problem and take action.
I made each design decision based on user feedback and real data challenges. This screen shows how I structured information from gap insights to cost planning, so HR teams can easily understand the problem and take action.
I made each design decision based on user feedback and real data challenges. This screen shows how I structured information from gap insights to cost planning, so HR teams can easily understand the problem and take action.


Final UI Designs
The final UI design integrates data clarity, accessibility, and visual hierarchy to support HR teams in identifying and addressing pay equity issues across departments.


Final UI Designs
Final UI Designs
The final UI design integrates data clarity, accessibility, and visual hierarchy to support HR teams in identifying and addressing pay equity issues across departments.
The final UI design integrates data clarity, accessibility, and visual hierarchy to support HR teams in identifying and addressing pay equity issues across departments.
Prototype Video
Prototype Video
Usability Test Summary
Usability Test Summary
We conducted usability testing with HR professionals to evaluate the effectiveness of the Pay Equity tool. Users were asked to upload data, identify pay gaps, apply filters, and generate reports. The feedback was positive, participants found the interface intuitive, the data visualizations easy to interpret, and the report generation process smooth and efficient. The tool was seen as a valuable asset in simplifying complex compensation data and improving decision making.
We conducted usability testing with HR professionals to evaluate the effectiveness of the Pay Equity tool. Users were asked to upload data, identify pay gaps, apply filters, and generate reports. The feedback was positive, participants found the interface intuitive, the data visualizations easy to interpret, and the report generation process smooth and efficient. The tool was seen as a valuable asset in simplifying complex compensation data and improving decision making.
80%
said the tool was easy to navigate and understand
90%
completed core tasks (upload, analyze, export) without assistance
85%
felt confident identifying pay gaps using visual insights
70%
said they would recommend the tool to peers in HR
Prototype Video
Prototype Video
Usability Test Summary
Usability Test Summary
We conducted usability testing with HR professionals to evaluate the effectiveness of the Pay Equity tool. Users were asked to upload data, identify pay gaps, apply filters, and generate reports. The feedback was positive, participants found the interface intuitive, the data visualizations easy to interpret, and the report generation process smooth and efficient. The tool was seen as a valuable asset in simplifying complex compensation data and improving decision making.
We conducted usability testing with HR professionals to evaluate the effectiveness of the Pay Equity tool. Users were asked to upload data, identify pay gaps, apply filters, and generate reports. The feedback was positive, participants found the interface intuitive, the data visualizations easy to interpret, and the report generation process smooth and efficient. The tool was seen as a valuable asset in simplifying complex compensation data and improving decision making.
80%
said the tool was easy to navigate and understand
90%
completed core tasks (upload, analyze, export) without assistance
85%
felt confident identifying pay gaps using visual insights
70%
said they would recommend the tool to peers in HR
80%
said the tool was easy to navigate and understand
90%
completed core tasks (upload, analyze, export) without assistance
70%
said they would recommend the tool to peers in HR
85%
felt confident identifying pay gaps using visual insights